jit.scope
Description
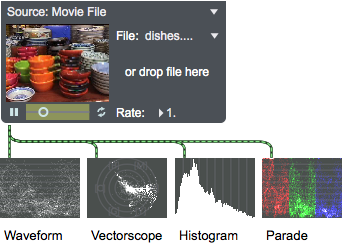
jit.scope lets you visually inspecting matrix values and display them as waveform, vectorscope, histogram or parade visual data.
Examples
Arguments
None.
Attributes
accum [int] (default: 25)
Sets the amount of data, per pixel, to accumulate for display.
accum_desat [float] (default: 0.35)
When the jit.scope object is set to parade mode, this attribute sets the desaturation for the display (expressed as a float in the range 0. 1.0).
bgcolor [4 floats]7.0.0
Sets the background color of the object in RGBA format
colormode [symbol] (default: argb)
Sets the color mode. The options are:
argb (the default)
uyvy
Possible values:
'argb'
'uyvy'
dstrect [4 ints]
Specifies the portion of the output matrix written to by the input frame (default = 0 0 (matrix width) (matrix height)) The proportions of the rectangle are expressed in the form left top right bottom . All values are relative to the top left corner of the object's viewing area.
graphcolor [4 floats]
Sets the Graph Color in RGBA format. The attribute is mapped to the style color.
graphmode [symbol] (default: luminance)
When the jit.scope object is set to histogram mode, this attribute sets the data to be displayed. The options are:
luminance: displays a luminance (monochrome) display of histogram values
rgb: displays an overlaid set of histograms for R, G, and B values.
Possible values:
'luminance'
'rgb'
hgraphcolor [4 floats]
Sets the Graph Color displayed on hover in RGBA format. The attribute is mapped to the style color.
interp [int] (default: 0)
Interpolation flag (default = 0) When the flag is set, the incoming matrix is interpolated when scaling to display.
mode [symbol] (default: waveform)
Sets the display mode of the jit.scope object. The modes are:
waveform: signal values (y) plotted over time (x)
vectorscope: an x-y plot of two signals
histogram: a plot of the disbribution of values for an input signal
parade: a scrolling display of R, G, and B values shown on a single screen
Possible values:
'waveform'
'vectorscope'
'histogram'
'parade'
planemap [4 ints]
Sets input plane to output plane mapping (default = 0 1 2 3 ...)
size [2 ints]
Sets the window size (width and height) (default = 320 240)
srcrect [4 ints]
Specifies Specifies the portion of the input matrix used when copying an input matrix to the internal matrix. (default = 0 0 (matrix width) (matrix height)) The proportions of the rectangle are expressed in the form left top right bottom . All values are relative to the top left corner of the viewing area of the input matrix.
style [symbol] (default: )7.0.0
Sets the style to be applied to the object. Styles can be set using the Format palette.
Common Box Attributes
annotation [symbol]
Sets the text that will be displayed in the Clue window when the user moves the mouse over the object.
background [int] (default: 0)
Adds or removes the object from the patcher's background layer. adds the object to the background layer, removes it. Objects in the background layer are shown behind all objects in the default foreground layer.
color [4 floats]
Sets the color for the object box outline.
fontface [int]
Sets the type style used by the object. The options are:
plain
bold
italic
bold italic
Possible values:
0 = 'regular'
1 = 'bold'
2 = 'italic'
3 = 'bold italic'
fontname [symbol]
Sets the object's font.
fontsize [float]
Sets the object's font size (in points).
Possible values:
'8'
'9'
'10'
'11'
'12'
'13'
'14'
'16'
'18'
'20'
'24'
'30'
'36'
'48'
'64'
'72'
hidden [int] (default: 0)
Toggles whether an object is hidden when the patcher is locked.
hint [symbol]
Sets the text that will be displayed in as a pop-up hint when the user moves the mouse over the object in a locked patcher.
ignoreclick [int] (default: 0)
Toggles whether an object ignores mouse clicks in a locked patcher.
jspainterfile [symbol]
JS Painter File
patching_rect [4 floats] (default: 0. 0. 100. 0.)
Sets the position and size of the object in the patcher window.
position [2 floats]
Sets the object's x and y position in both patching and presentation modes (if the object belongs to its patcher's presentation), leaving its size unchanged.
presentation [int] (default: 0)
Sets whether an object belongs to the patcher's presentation.
presentation_rect [4 floats] (default: 0. 0. 0. 0.)
Sets the x and y position and width and height of the object in the patcher's presentation, leaving its patching position unchanged.
rect [4 floats]
Sets the x and y position and width and height of the object in both patching and presentation modes (if the object belongs to its patcher's presentation).
size [2 floats]
Sets the object's width and height in both patching and presentation modes (if the object belongs to its patcher's presentation), leaving its position unchanged.
textcolor [4 floats]
Sets the color for the object's text in RGBA format.
textjustification [int]
Sets the justification for the object's text.
Possible values:
0 = 'left'
1 = 'center'
2 = 'right'
varname [symbol]
Sets the patcher's scripting name, which can be used to address the object by name in pattr, scripting messages to thispatcher, and the js object.
Messages
bang
jit_matrix
Arguments
(mouse)
See Also
| Name | Description |
|---|---|
| Working with Video in Jitter | Working with Video in Jitter |
| jit.grab | Digitize video from an external source |
| jit.histogram | Calculate matrix histogram |
| jit.movie | Play a movie |