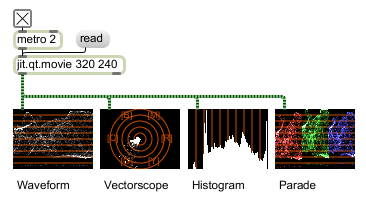
Examples

Visual matrix analysis tools
| bang | Outputs the current matrix. | |
| jit_matrix | window-size [list] |
Displays the input matrix by scaling to the window size. |
| (mouse) | Clicking with the mouse will display a horizontal or vertical line trace and numerical cursor. |
| Name | Type | g/s | Description |
|---|---|---|---|
| accum | int def.:25 |
Sets the amount of data, per pixel, to accumulate for display. | |
| accum_desat | float def.:0.35 |
When the jit.scope object is set to parade mode, this attribute sets the desaturation for the display (expressed as a float in the range 0. 1.0). | |
| border | float def.:0. |
Window border flag (default = 1) When the flag is set, the window is displayed with a border. | |
| colormode | symbol def.:argb |
Sets the color mode. The options are: argb (the default) uyvy |
|
| dstrect | int | Specifies the portion of the output matrix written to by the input frame (default = 0 0 (matrix width) (matrix height)) The proportions of the rectangle are expressed in the form left top right bottom . All values are relative to the top left corner of the object's viewing area. | |
| graphcolor | float def.:0.8 0.3 0. 1. |
Sets the Graph Color in RGBA format. | |
| graphmode | symbol def.:luminance |
When the jit.scope object is set to histogram mode, this attribute sets the data to be displayed. The options are: luminance: displays a luminance (monochrome) display of histogram values rgb: displays an overlaid set of histograms for R, G, and B values. |
|
| hgraphcolor | float def.:0.8 0.8 0. 1. |
Sets the Graph Color displayed on hover in RGBA format. | |
| hpopupbackgcolor | float def.:0.2 0.2 0.2 1. |
Sets the Popup Highlight Background Color in RGBA format. | |
| hpopupcolor | float def.:1. 1. 1. 1. |
Sets the Popup Highlight Text Color in RGBA format. | |
| interp | int def.:0 |
Interpolation flag (default = 0) When the flag is set, the incoming matrix is interpolated when scaling to display. | |
| mode | symbol def.:waveform |
Sets the display mode of the jit.scope object. The modes are: waveform: signal values (y) plotted over time (x) vectorscope: an x-y plot of two signals histogram: a plot of the disbribution of values for an input signal parade: a scrolling display of R, G, and B values shown on a single screen |
|
| planemap | int | Sets input plane to output plane mapping (default = 0 1 2 3 ...) | |
| popupbackgcolor | float def.:0. 0. 0. 1. |
Sets the Popup Background Color in RGBA format. | |
| popupcolor | float def.:0.9 0.9 0.9 1. |
Sets the Popup Text Color in RGBA format. | |
| size | int | Sets the window size (width and height) (default = 320 240) | |
| srcrect | int | Specifies Specifies the portion of the input matrix used when copying an input matrix to the internal matrix. (default = 0 0 (matrix width) (matrix height)) The proportions of the rectangle are expressed in the form left top right bottom . All values are relative to the top left corner of the viewing area of the input matrix. |

| Name | Description |
|---|---|
| jit.dx.grab | Digitize video from an external source using DirectX (Windows only) |
| jit.histogram | Calculate histogram |
| jit.qt.grab | Digitize video from an external source |
| jit.qt.movie | Play or edit a QuickTime movie |