Examples
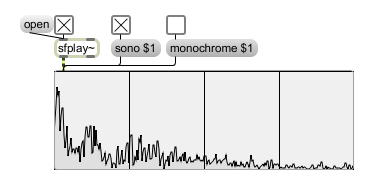
Display a sonogram in living color
Signal spectrogram or sonogram
| signal | In left inlet: The input signal is analyzed and its spectrum is displayed. If the object is placed inside a pfft~ object's subpatcher, the left inlet is used for the real signal coming from the left outlet of a fftin~ object. In right inlet: If the object is placed inside a pfft~ object's subpatcher, the right inlet is used for the imaginary signal coming from the second outlet of a fftin~ object. When not inside a pfft~ subpatcher, this inlet does nothing. |
| Name | Type | g/s | Description |
|---|---|---|---|
| bgcolor | float | Sets the Spectrogram Background Color of the spectroscope~ object in RGBA format. | |
| border | int def.:1 |
Toggles drawing a border around the spectroscope~ object. | |
| bordercolor | float | Sets the border color of the spectroscope~ object in RGBA format. | |
| curvecolor | float | Sets the curve color of the spectroscope~ object in RGBA format. | |
| domain | float def.:0. 22050. |
Sets the low and high domain (frequency) values. | |
| fgcolor | float | Sets the Spectrogram Foreground Color of the spectroscope~ object in RGBA format. | |
| interval | int def.:20 |
Sets the polling interval, in milliseconds. | |
| logamp | int def.:1 |
Toggles between linear (0) and logarithmic (1) amplitude display. By default it is set to logarithmic display. | |
| logfreq | int def.:0 |
Toggles log frequency display. By default it is off, but when turned on, the spectrogram or sonogram's frequencies are shown on a logarithmic scale. | |
| markercolor | float | Sets the marker color of the spectroscope~ object in RGBA format. | |
| monochrome | int def.:1 |
Toggles monochrome display of the sonogram. The default setting of the attribute is 1 (a two-color sonogram display). When turned off, the sonogram display uses a series of five colors. | |
| orientation | int def.:0 |
Sets the vertical or horizontal orientation of the spectroscope~ object. By default it is horizontal, which means frequencies are displayed along the horizontal axis and amplitudes are displayed along the vertical axis in spectrogram mode, and time is displayed along the horizontal axis and frequency is displayed along the vertical axis in sonogram mode. In vertical mode the axes are reversed. | |
| phasespect | int def.:0 |
Toggles the Amplitude/Phase spectrum display. | |
| range | float def.:0. 1.2 |
Sets the minimum and maximum displayed amplitudes of the spectrum. The default values are 0 and 1.2, for the minimum and maximum, respectively. If the word is followed by only one number, then it is used as the maximum value, and the minimum range is set to zero. | |
| rounded | int def.:8 |
Sets the roundness (radius), in pixels, for the spectroscope~ object. | |
| scroll | int def.:0 |
Sets the sonogram scrolling mode. By default the sonogram scrolling mode is set to Forward Draw (). The scrolling modes are as follows: Forward Draw - drawing location moves right or down Reverse Draw - drawing location moves left or up Forward Scroll - sonogram scrolls right or down Reverse Scroll - sonogram scrolls left or up |
|
| sono | int def.:0 |
Toggles sonogram mode. By default the sonogram display is off (meaning it displays a spectrogram, instead). N.B.: Although the terms "spectrogram" and "sonogram" are generally used interchangably to refer to a graph of the spectrum over time, we are using "spectrogram" in its literal sense - to refer to the drawing of a spectrum as an amplitude/frequency representation. | |
| sonohicolor | float | Sets the color in RGBA format used by the spectroscope~ for displaying frequencies in the high audio range when the object is in color sonogram mode. | |
| sonolocolor | float | Sets the color in RGBA format used by the spectroscope~ for displaying frequencies in the low audio range when the object is in color sonogram mode. | |
| sonomedcolor | float | Sets the color in RGBA format used by the spectroscope~ for displaying frequencies in the medium audio range when the object is in color sonogram mode. | |
| sonomedhicolor | float | Sets the color in RGBA format used by the spectroscope~ for displaying frequencies in the medium high audio range when the object is in color sonogram mode. | |
| sonomedlocolor | float | Sets the color in RGBA format used by the spectroscope~ for displaying frequencies in the low medium audio range when the object is in color sonogram mode. | |
| sonomonobgcolor | float | Sets the background color of the spectroscope~ display in RGBA format when the object is displaying sonograms in two-color mode. | |
| sonomonofgcolor | float | Sets the foreground color of the spectroscope~ display in RGBA format when the object is displaying sonograms in two-color mode. |