Quickstart
Max provides an collection of functions for custom drawing called the MGraphics JavaScript API. Using this API, can perform common drawing tasks:
- Draw shapes like rectangles, ellipses, and paths
- Test the intersection of paths with the mouse position
- Draw bitmap and SVG images
- Draw repeating patterns and gradients
MGraphics is not a separate Max object. Rather, you access the MGraphics API by programming with JavaScript. You can override the appearance of most UI objects by setting their @jspainterfile attribute to a JavaScript file, and the v8ui and jsui objects let you create a fully customizable UI objects, including custom handling for mouse events.
This series of tutorials will get you started with MGraphics. More in-depth information can be found in the user guide and API docs:
- Override the default appearance of a UI object — Custom UI Objects
- Handle interaction events with jsui and v8ui — Event Handlers with jsui
- Full API reference for custom drawing — MGraphics API Reference
Simple Drawing
When you create a new v8ui object, what you see will look very similar to the Max dial object. That's because the default drawing code for v8ui is a JavaScript implementation of the drawing code for dial. With the patcher unlocked, you can hold ⌘ (macOS) or Command (Windows) and double-click on the v8ui dial object to see the JavaScript code.
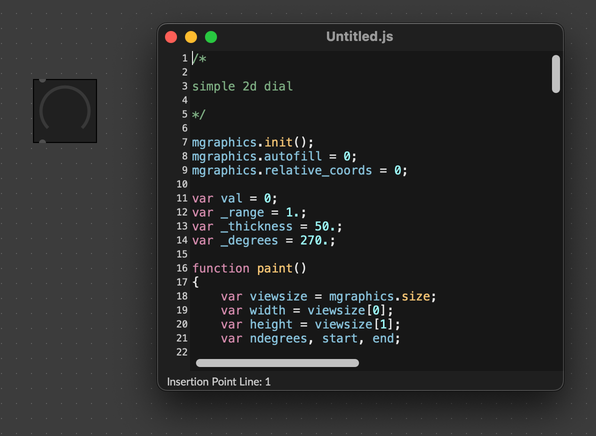
You don't need to worry about breaking the "factory" drawing code by saving this file. When you create a new v8ui object, Max copies the default drawing code and embeds it in the patcher. So, you can edit and save this code freely.
Feel free to look through the code to get a sense of how it works. We'll walk through each of the parts at a high level, to see how all the pieces fit together.
Initialization
In the global scope of your JavaScript file, usually near the top, call mgraphics.init() to initialize your object for MGraphics drawing. This is also a good time to configure the MGraphics context globally. For example, you could configure mgraphics for relative coordinates, or tell mgraphics not to fill shapes automatically when you use the stroke() functions by disabling autofill.
// Set up the object for mgraphics drawing
mgraphics.init();

// Optionally, configure the global mgraphics instance
mgraphics.autofill = 0; // Don't automatically fill an object when you draw its stroke
mgraphics.relative_coords = 1; // Enable relative coordinates for this object
Paint Function
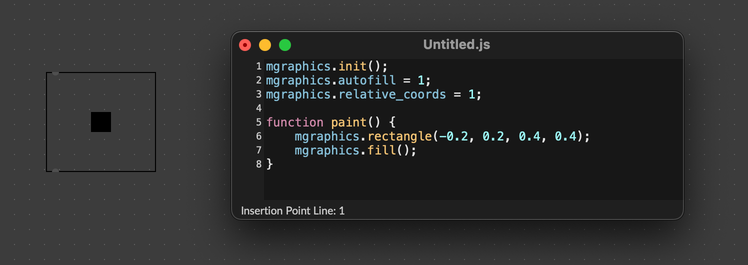
Somewhere in your custom drawing file, you must define a paint() function. This is where you put your drawing code (or function calls that do the drawing). You should not call this function directly. Instead, Max will call this function automatically whenever the object needs to be redrawn. You can also force a repaint by calling the function mgraphics.redraw().
mgraphics.init();
mgraphics.autofill = 1;
mgraphics.relative_coords = 1;

function paint() {
	mgraphics.rectangle(-0.2, 0.2, 0.4, 0.4);
	mgraphics.fill();
}
Drawing Concepts
Whether you're drawing a path, shape, or text, the formula for drawing with MGraphics is more or less the same:
- Set the colors and properties of the thing you want to draw.
- Create the path, shape, text, or other thing to draw.
- Call a function to execute the drawing.
So a drawing routine might look like:
mgraphics.init();
mgraphics.autofill = 1;
mgraphics.relative_coords = 1;

function paint() {
  mgraphics.set_source_rgba(0.2, 0.8, 0.2, 1); // Set the color to a light green
  mgraphics.set_line_width(0.25); // Set the line width (respects relative coordinates)
  mgraphics.move_to(-1.0, -1.0); // Move to the bottom-left
  mgraphics.line_to(1.0, 1.0); // Add a line segment from the current position to the top-right
  mgraphics.stroke(); // Outline the path, and reset the current path
}
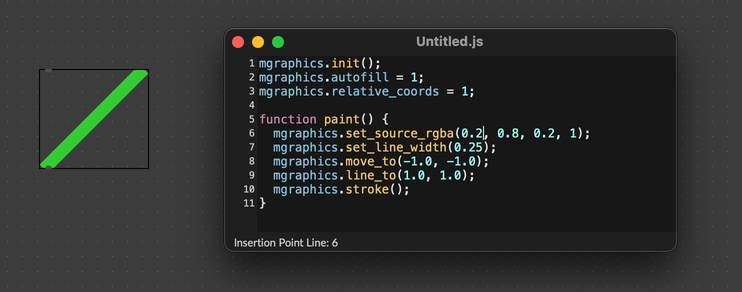
You'll see function calls related to each of these three main drawing phases:
mgraphics.set_source_rgba(0.2, 0.8, 0.2, 1);— this sets the drawing colormgraphics.line_to(1.0, 1.0);— this adds a line to the current pathmgraphics.stroke();— this "paints" the current path, adding it to the canvas.
In an older version of the Max documentation, you may have seen a code example using the with keyword, to avoid writing mgraphics so often.
with (mgraphics) {
  set_source_rgba(0.2, 0.8, 0.2, 1); // Set the color to a light green
  set_line_width(0.25); // Set the line width (respects relative coordinates)
}
This is still perfectly valid and you're welcome to do it. However, it's not a very common pattern in modern JavaScript, so we're no longer recommending it.
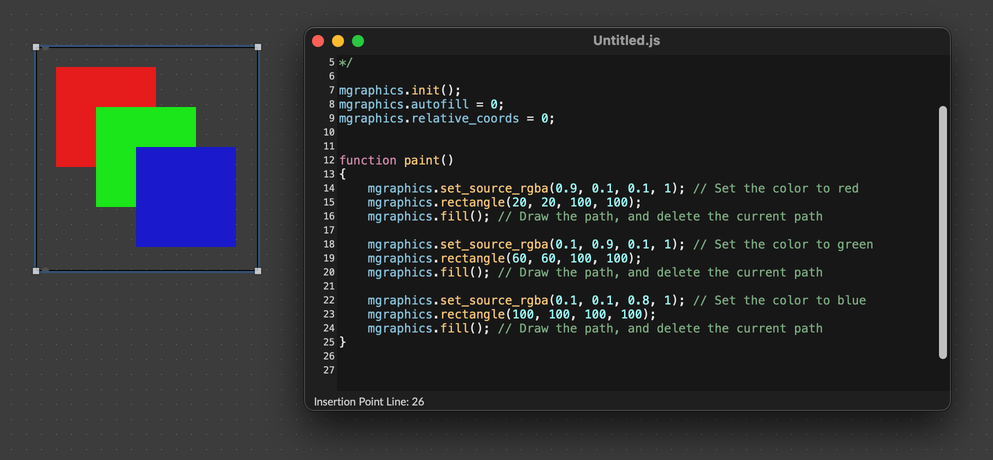
Drawing with MGraphics uses a "painter's canvas" drawing model. The order in which you call drawing functions like stroke() and fill() determines the order in which shapes appear. All paths are drawn "on top", so drawing new shapes may obscure older ones.
function paint()
{
	mgraphics.set_source_rgba(0.9, 0.1, 0.1, 1); // Set the color to red
	mgraphics.rectangle(20, 20, 100, 100);
 	mgraphics.fill(); // Fill the path, and reset the current path

	mgraphics.set_source_rgba(0.1, 0.9, 0.1, 1); // Set the color to green
	mgraphics.rectangle(60, 60, 100, 100);
 	mgraphics.fill(); // Fill the path, and reset the current path

	mgraphics.set_source_rgba(0.1, 0.1, 0.8, 1); // Set the color to blue
	mgraphics.rectangle(100, 100, 100, 100);
 	mgraphics.fill(); // Fill the path, and reset the current path
}
The MGraphics Coordinate System
MGraphics supports two coordinate systems: relative and absolute. With absolute coordinates, the origin (0, 0) is the top-left of the canvas, and (width, height) would be the bottom-right of the canvas. If your display was 400 by 200, you could draw an 'X' filling this area with code like this:
/**
 * Draw a cross using absolute coordinates. This shape will always be the
 * same size, no matter how the mgraphics context is resized.
 */
function paint() {
  mgraphics.move_to(0, 0) // the top-left
  mgraphics.line_to(400, 200) // the bottom-right
  mgraphics.stroke() // draw it

  mgraphics.move_to(400, 0) // the top-right
  mgraphics.line_to(0, 200) // the bottom-left
  mgraphics.stroke()
}
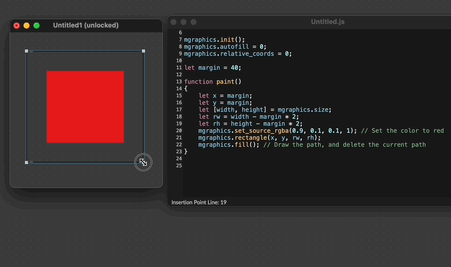
You can fetch the width and height of the drawing context using the size property of the global mgraphics object. Use this to draw shapes that fill the drawing canvas, even as the size of the object changes.
let margin = 40;

function paint()
{
	let x = margin;
	let y = margin;
	let [width, height] = mgraphics.size;
	let rw = width - margin * 2;
	let rh = height - margin * 2;
	mgraphics.set_source_rgba(0.9, 0.1, 0.1, 1); // Set the color to red
	mgraphics.rectangle(x, y, rw, rh);
 	mgraphics.fill(); // Fill the path, and reset the current path
}
Switch to the relative coordinate system by setting relative_coords to 1 on your MGraphics object. After enabling relative coordinates, the origin (0, 0) will be at the center of the canvas, the point (-1, -1) will be at the bottom-left, and (1, 1) will be at the top-right.
Switching to relative coordinates inverts the Y axis. With absolute coordinates, increasing Y values move further down, while in relative coordinates, increasing Y values move further up.
/**
 * Draw a cross using relative coordinates. This drawing will stretch to
 * fill the full width and height of the drawing context
 */
mgraphics.relative_coords = 1;

function paint() {
  mgraphics.move_to(-1, -1) // the top-left
  mgraphics.line_to(1, 1) // the bottom-right
  mgraphics.stroke() // draw it

  mgraphics.move_to(1, -1) // the top-right
  mgraphics.line_to(-1, 1) // the bottom-left
  mgraphics.stroke()
}
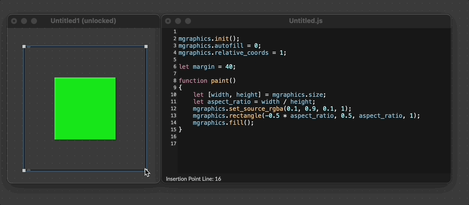
The relative coordinate system will always normalize its coordinates with respect to the vertical dimension. So, if the drawing context is wider than it is tall, then the left edge will have a coordinate that is less than -1 and a right edge greater than 1. You can use the size property of the mgraphics object to calculate the aspect ratio of the drawing context, if you want to consistent drawing at any size.
mgraphics.init();
mgraphics.relative_coords = 1;

function paint()
{
	let [width, height] = mgraphics.size;
	let aspect_ratio = width / height;
	mgraphics.set_source_rgba(0.1, 0.9, 0.1, 1);
	mgraphics.rectangle(-0.5 * aspect_ratio, 0.5, aspect_ratio, 1);
 	mgraphics.fill();
}
Handling Events
The jsui and v8ui object can also handle simple UI events, including mouse and resize events. To respond to these events, implement a function with a name like on<eventname> where <eventname> is the name of the event you want jsui to respond to. For example, to handle a mouse click event:
function onclick(x, y) {
  someOtherFunction(x, y);
  mgraphics.redraw();
}
In addition to the onclick method, the other supported methods are ondblclick, ondrag, onidle, onidleout, and onresize. For a full description, see Custom UI Objects.
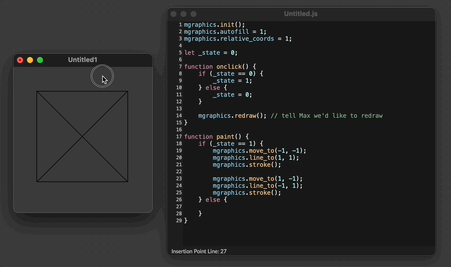
Here's how you could use MGraphics to implement a toggle-like object.
mgraphics.init();
mgraphics.autofill = 1;
mgraphics.relative_coords = 1;

let _state = 0;

function onclick() {
	if (_state == 0) {
		_state = 1;
	} else {
		_state = 0;
	}

	mgraphics.redraw(); // tell Max we'd like to redraw
}

function paint() {
	if (_state == 1) {
		mgraphics.move_to(-1, -1);
		mgraphics.line_to(1, 1);
		mgraphics.stroke();

		mgraphics.move_to(1, -1);
		mgraphics.line_to(-1, 1);
		mgraphics.stroke();
	} else {
		// Do nothing
	}
}
