JavaScript and the Half-edge Structure
Now that we've had some experience working with the jit.geom object family, we're ready to go into a bit more detail about the half-edge structure itself. We'll see how to work with this structure, and we'll use JavaScript to create new meshes from the geometry structure.
The Half-edge Structure
When the graphics engine renders a shape, it does so by translating some kind of representation into a series of instructions to the graphics hardware in your computer. One simple but effective way to represent a shape is as a list of triangles or rectangles. In fact, if you've used jit.gl.gridshape before, this is the format that it uses to represent shapes.
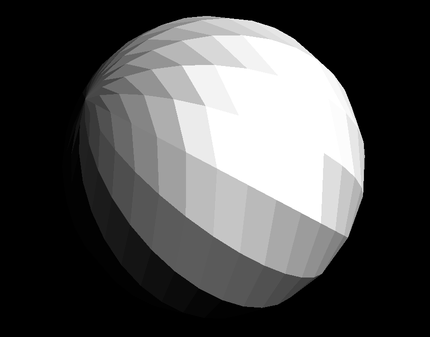
A list of triangles or rectangles is very easy to draw. Conceptually, all you have to do is walk through the whole list, get the position of each face, and draw that face onto the screen. However, this representation makes certain kinds of operations very difficult. For example, if you wanted to simplify the geometry by removing a single vertex, how would you know which faces to modify?
The half-edge geometry structure is designed to make just these kinds of manipulations possible. The basic idea is that each vertex should maintain a pointer to the next vertex in the shape. This pointer from one vertex to the next is the half-edge that gives the structure its name. Each half-edge also has a twin (sometimes called its opposite) that points from the next vertex back to the original. These two half-edges together make up one edge.
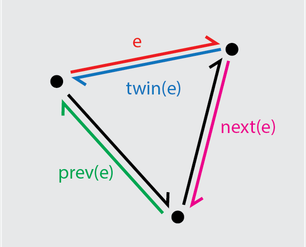
One more requirement completes the definition of the half-edge structure, that following the half-edges from one vertex to the next must loop around one face of the 3D shape. With this, transformations like smoothing, remeshing, subdividing, decimating, and extruding are all possible.
For more about the half-edge structure, we highly recommend this excellent, interactive write-up from Jerry Yin and Jeffrey Goh.
Dictionary Representation
Open the tutorial patch geom-04.maxpat. From the top, you'll see a set of objects that should look pretty familiar by this point. A jit.gl.model loads the model duck.dae, passing that model to jit.geom.togeom. The model is converted to a geometry, and then passed to a jit.geom.subdivide object. This object is the opposite of jit.geom.decimate, which we used in the previous tutorial to remove vertices from the geometry.
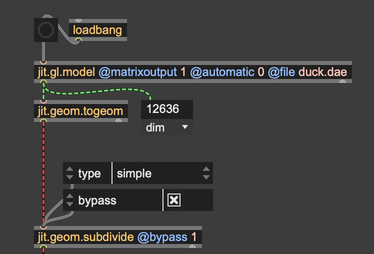
After this, we pass the geometry to a jit.geom.todict object. This object converts the geometry to a dictionary, which gives a bit more insight into the half-edge geometry structure.
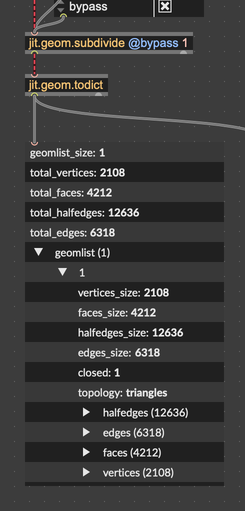
Take a look at the dictionary representation of a geometry structure. Some important highlights;
- geomlist_size: Each geometry can contain multiple shapes. However, in all the examples we've looked at, the geometry only contains one shape.
- geomlist: The geometries themselves are stored here. If there is only one geometry, this will be a list with a single element.
- closed: Whether or not the shape has holes in its surface.
Within a given geometry, you'll see a list halfedges. This is a simple list of each half edge.
- to: The index of the vertex to which this half edge is pointing.
- from: The index of the vertex from which this half edge is pointing.
- next: The index of the next half edge in the structure.
- prev: The index of the previous half edge in the structure.
- opposite: The index of the twin or opposite half edge.
- face: The index of the face to which this half edge belongs.
- tex: The texture coordinates or uvs of this half edge.
- normal: The surface normal vector of this half edge.
You'll also see a list of edges. Each one of these simply contains a pointer to the two half edges that belong to it.
Drawing Edges with JavaScript
As you can see, the half-edge representation gives a lot of structure to our shape. We can use this structure in JavaScript to create a wireframe. The basic idea looks something like this:
- Iterate through all the edges in our shape
- Get the coordinates of the endpoints of each edge
- Put those coordinates into a Jitter matrix
- Output that matrix
Open up the JavaScript file geom.draw.edges.js. You'll see that there's a single function defined, called `dictionary.
function dictionary(dictionaryName) {
  // ...
}
When we send a message to the JavaScript object like dictionary u01234567, this will call the JavaScript function dictionary with the argument u01234567, which is the name of the dictionary.
The first step is to get a reference to the dictionary itself from the dictinoary name.
	// Create a reference to the Max dictionary using the dictionary name
	let d = new Dict(dictionaryName);
Next, we convert the dictionary into a structure that we can easily navigate. We can turn the dictionary into a JavaScript object by first calling stringify to turn it into a string, then JSON.parse to parse that string in JavaScript Object Notation.
  // Turn this into a JavaScript object
	let fullGeometryDesc = JSON.parse(d.stringify());
Now we can actually walk through the geometry structure. With the JavaScript v8 engine, we can call a function on each of the edges in the geometry using big arrow notation.
edges.forEach(edge => {
  // do something for each edge
});
In particular, we get the half edges associated with each edge, and put their vertices into a list. Each edge has two half edges, but we only need one, since the two half edges each contain the same two points.
let [firstEdgeIndex, opposite] = halfEdges;
This line uses destructuring assignment to assign the two elements of the list halfEdges to two new variables. The variable firstEdgeIndex contains the first half edge. This stores the two vertices of the edge segment, but only their indices. To get the actual coordinates, we need to grab the vertices themselves from the geometry.
  // Get the actual vertex structure from the geometry
  let v1 = geom.vertices[fromVertexIndex];
  let v2 = geom.vertices[toVertexIndex];
Finally, we can store these vertices.
  wireFrameVertices.push(v1.point);
  wireFrameVertices.push(v2.point);
To create the output matrix, we make a three-plane matrix with one cell for each vertex. Then we set the cells of the matrix to be the vertex coordinates, and finally we output the matrix by name.
	let mLines = new JitterMatrix(3, "float32", wireFrameVertices.length);

	wireFrameVertices.forEach((vertex, idx) => {
		mLines.setcell(idx, "val", vertex)
	});

	outlet(0, "jit_matrix", mLines.name);
Drawing with jit.gl.mesh
To draw the wireframe, we don't have to do anything fancy. In fact, we can just send this matrix straight to jit.gl.mesh and it will take care of drawing the lines of our wireframe. This is because we set @draw_mode to lines, which is perfect for drawing wireframes in the format that we created in our JavaScript code.
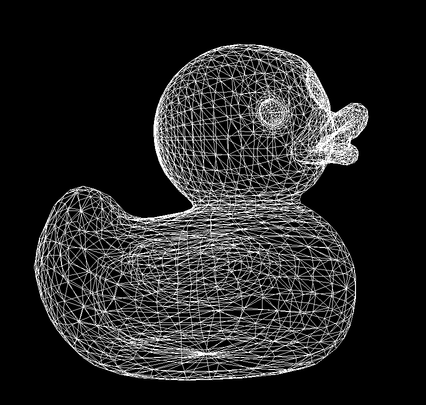
Just for fun, we can enable some animation that will offset each point by a small amount of noise. You'll see that this patch is using the new jit.bang object, which lets us get a bang each time the jit.pworld renders a frame. This retrieves a matrix of synthesized noise, letting us blend that noise with our wireframe mesh. Hopefully, this gives you another helpful example of how Jitter geometry can work with Jitter matrix objects to produce interesting visualizations.
