scope~
Description
Use the scope~ object to visualize an audio signal using an oscilloscope-style display.
Examples
Arguments
None.
Attributes
automatic [int] (default: 0)
Automatic Mode
bgcolor [4 floats]
Sets the background color in RGBA format.
bufsize [atom_long] (default: 128)
Number of samples stored in the buffer
calccount [atom_long] (default: 256)
Sets the number of samples per pixel to display
delay [float] (default: 0.)
Delay between each "trace" of oscilloscope in milliseconds
displaychan [int] (default: 1)
Display Channel
displaysinglechannel [int] (default: 0)
Single Channel
drawstyle [int] (default: 0)
Toggles an alternate drawing style which may make some waveforms more easily visible
fgcolor [4 floats]
Sets the phosphor color in RGBA format. The attribute is mapped to the style color.
gridcolor [4 floats]
Sets the grid color in RGBA format. The gridcolor attribute is mapped to the style color.
inactivealpha [float] (default: 0.3)
Inactive Channel Alpha
range [2 floats] (default: -1. 1.)
Minimum/maximum amplitudes displayed vertically
style [symbol] (default: )7.0.0
Sets the style to be applied to the object. Styles can be set using the Format palette.
trigger [int] (default: 0)
Trigger mode determines when a new waveform trace begins (following the
delay
).
sets an upward trigger in which the signal must go from being below the
triglevel
to being equal to it or above it.
sets a downward trigger in which the signal must go from being above the
triglevel
level to being equal to it or below it.
The default trigger mode is 0, which does not wait after a non-zero delay period before collecting samples again.
Possible values:
0 = 'None'
1 = 'Up'
2 = 'Down'
triglevel [float] (default: 0.)
Threshold to trip trigger mode. When trigger mode is 1 or 2, the waveform must increase or decrease past this value to trigger a new trace. If you are displaying a periodic waveform, slight changes to the trigger level will shift the waveform to the left or right.
Common Box Attributes
annotation [symbol]
Sets the text that will be displayed in the Clue window when the user moves the mouse over the object.
background [int] (default: 0)
Adds or removes the object from the patcher's background layer. adds the object to the background layer, removes it. Objects in the background layer are shown behind all objects in the default foreground layer.
color [4 floats]
Sets the color for the object box outline.
fontface [int]
Sets the type style used by the object. The options are:
plain
bold
italic
bold italic
Possible values:
0 = 'regular'
1 = 'bold'
2 = 'italic'
3 = 'bold italic'
fontname [symbol]
Sets the object's font.
fontsize [float]
Sets the object's font size (in points).
Possible values:
'8'
'9'
'10'
'11'
'12'
'13'
'14'
'16'
'18'
'20'
'24'
'30'
'36'
'48'
'64'
'72'
hidden [int] (default: 0)
Toggles whether an object is hidden when the patcher is locked.
hint [symbol]
Sets the text that will be displayed in as a pop-up hint when the user moves the mouse over the object in a locked patcher.
ignoreclick [int] (default: 0)
Toggles whether an object ignores mouse clicks in a locked patcher.
jspainterfile [symbol]
JS Painter File
patching_rect [4 floats] (default: 0. 0. 100. 0.)
Sets the position and size of the object in the patcher window.
position [2 floats]
Sets the object's x and y position in both patching and presentation modes (if the object belongs to its patcher's presentation), leaving its size unchanged.
presentation [int] (default: 0)
Sets whether an object belongs to the patcher's presentation.
presentation_rect [4 floats] (default: 0. 0. 0. 0.)
Sets the x and y position and width and height of the object in the patcher's presentation, leaving its patching position unchanged.
rect [4 floats]
Sets the x and y position and width and height of the object in both patching and presentation modes (if the object belongs to its patcher's presentation).
size [2 floats]
Sets the object's width and height in both patching and presentation modes (if the object belongs to its patcher's presentation), leaving its position unchanged.
textcolor [4 floats]
Sets the color for the object's text in RGBA format.
textjustification [int]
Sets the justification for the object's text.
Possible values:
0 = 'left'
1 = 'center'
2 = 'right'
varname [symbol]
Sets the patcher's scripting name, which can be used to address the object by name in pattr, scripting messages to thispatcher, and the js object.
Messages
int
Arguments
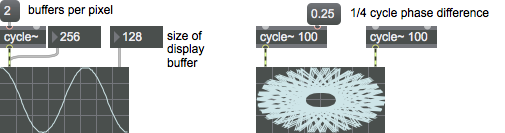
Right inlet: Size of the display buffer. This controls the rate at which scope~ redisplays new information as well as the scaling of that information. If the buffer size is larger, the signal image will stay on the screen longer and be visually compressed. If the buffer size is smaller, the signal image will stay on the screen a shorter time before it is refreshed and will be visually expanded.
It might appear that the samples per display buffer element and the display buffer size controls do the same thing but they have subtly different effects. You may need to experiment with both controls to find the optimum display parameters for your application.
(mouse)
signal
Right inlet: signal to display on the Y axis of the oscilloscope
If signal objects are connected to both the left and right inlets, scope~ operates in X-Y mode, plotting points whose horizontal position corresponds to the value of the signal coming into the left (X) inlet and whose vertical position corresponds to the value of the signal coming into the right (Y) inlet. If the two signals are identical and in phase, a straight line increasing from left to right will be seen. If the two signals are identical and 180 degrees out of phase, a straight line decreasing from left to right will be seen. Other combinations may produce circles, ellipses, and Lissajous figures.
Output
visual
The waveform of the incoming signal is displayed within the oscilloscope display.
See Also
| Name | Description |
|---|---|
| MC | MC |
| gridmeter~ | Display signal levels as brightness |
| meter~ | Visual peak level indicator |
| MSP Analysis Tutorial 2: Oscilloscope and Spectroscope | MSP Analysis Tutorial 2: Oscilloscope and Spectroscope |