Debugging and Probing
Debugging
With Debugging, you can monitor any messages passing along a patchcord, or pause execution and walk through processing in the patcher step by step. Debugging starts with Watchpoints, which you can configure to monitor, print, or pause. To add a watchpoint, right-click on any patchcord and select Add Watchpoint, or select a patchcord and select Add Watchpoint from the Debug menu.
- Print Watchpoint: A Watchpoint that will print a message to the Max Console whenever a message passes through the patch cord. This message indicates the source and destination of the message, along with its contents.
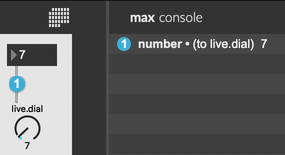
A print watchpoint printing its message - Monitor Watchpoint: Display a popup in the Max patcher when a message passes through the patchcord.
- Break Watchpoint: Pause execution and open the Debug Window whenever a message passes through the patchcord.
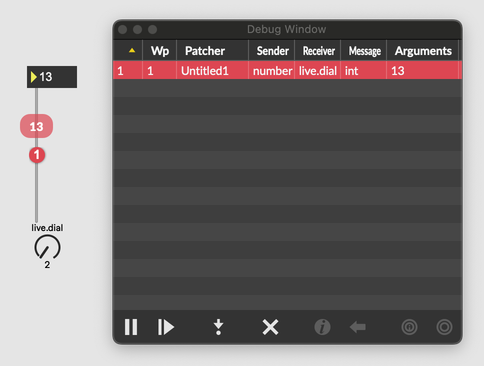
A break watchpoint pausing execution. You can see that the value 13 has not yet reached the live.dial, which still displays the value 2.
Enabling/disabling Debug Mode
Choose Debugging from the Debug menu to enable debugging. You can also use the Debug icon in the bottom toolbar to toggle debugging, as well as enabling Illustration Mode.

Stepping Through
When a Break Watchpoint is triggered, execution pauses and Max will focus on the Debug Window. From here you can see the sender, receiver, and contents of the message that triggered the watchpoint.
After triggering a breakpoint, The Continue button will let you resume execution, and the Abort button will effectively remove the message from Max's scheduler and exit debugging. This can be really useful, especially if the message is about to do something that you don't want.
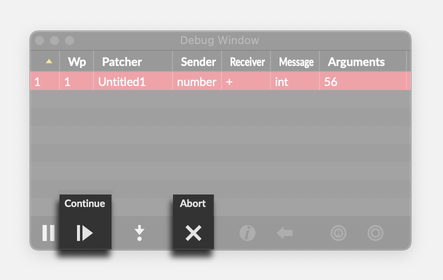
The Step button is a very powerful tool in the Debug Window, allowing you to walk through the flow of messages in a Max patcher one step at a time.
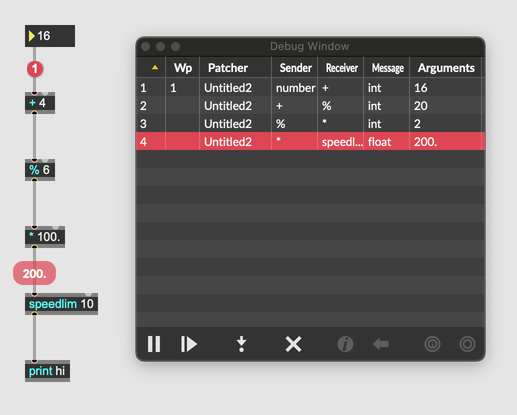
When stepping, whenever sending a message to an object triggers a new message, the new message will appear at the bottom of the execution stack. In this way, you can see the whole processing chain in response to a message.
If you are in the middle of debugging, you cannot operate your patcher. In addition, you cannot close the patcher window being debugged, and you cannot quit Max. To exit debugging and enable these functions again, choose Abort from the Debug menu, and you will be able to operate Max normally.
Illustration Mode
- Introduction
- Activating illustration mode
- Clearing pending messages
Probing
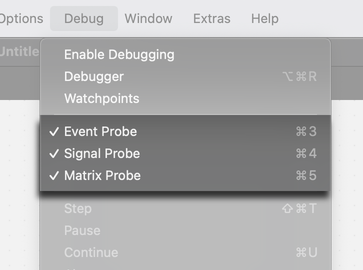
Probing lets you see the last message that passed through a patch cord by hovering over the patch cord you want to inspect. With probing you can see messages, matrices and textures, as well as audio vectors passing between objects. Event Probing, Signal Probing, and Matrix Probing must all be enabled from the Debug menu before you can use them.
Event Probing
With Event Probe enabled, hovering over any patchcord will display the last message that passed through, or else no data if no message has passed through.
Signal Probe
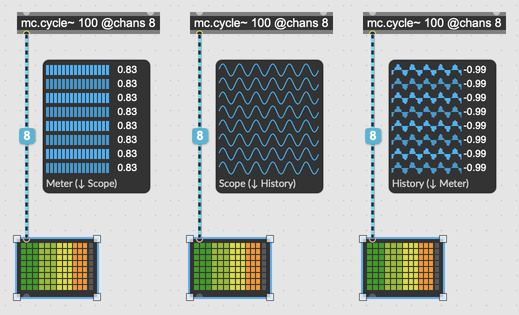
The Signal Probe lets you see the audio data passing between two objects. With Signal Probe enabled, hover over any audio patch cord to get a visualization of the data. While the signal probe popup is visible, you can press the up or down arrow keys to cycle between Meter, Scope, and History views.

Signal Processing must be enabled in order to use the Signal Probe.
The Signal Probe also works with mc.* objects.
Matrix Probe
Unlike the Signal Probe and Event Probe, the Matrix Probe displays in a separate window. Enabling Matrix Probe from the Debug menu will display the Matrix Probe window.
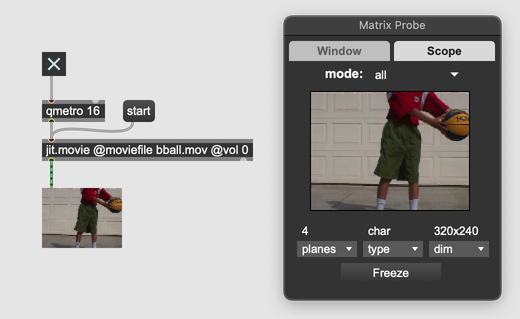
From the Window tab, the Mode chooser will let you choose which plane of the matrix to inspect—alpha, red, green, blue, or a composite of all four.
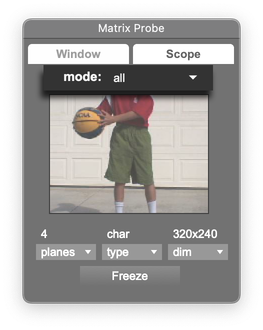
The dropdown menus at the bottom of the window will let you view additional information about the matrix, including the number of planes, the type of data contained in the matrix, and the dimensions of the matrix.
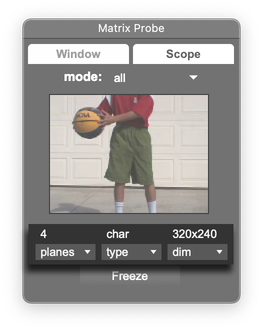
The Scope tab shows useful statistics about the matrix. For example, the vectorscope view shows the distribution of color intensities, which can help you visualize which colors are most common in the matrix.
