Web Browser and jweb
Max contains a web browser, implemented with the Chromium Embedded Framework (CEF). You can access this browser through the jweb object, which lets you embed a web browser in your Max patcher. The jweb~ object will capture audio from whatever webpage you're on, letting you route that audio through your patcher. Finally, you can use JavaScript to receive messages from Max, to send messages to the object outlets, and to access dictionaries in Max.
jweb
Create a jweb object to make an instance of an embedded web browser.

The @rendermode attribute determines whether the page is rendered directly in the object view, or whether it's rendered offscreen and then composited into the patcher. Onscreen rendering is slightly more efficient, but the jweb browser view will always render on top of other objects.

JavaScript Communication
You can communicate with the contents of a page loaded with jweb through the max object. When jweb loads a page, it adds this object to the global window object. You can use this to determine, from JavaScript, whether the page was loaded in Max.
if (window.max) {
    console.log("This webpage is loaded in Max, from a jweb object");
} else {
    console.log("This webpage is not loaded in Max.")
}
It's important to note that CEF runs in a separate process from the rest of Max. If you send a message to a jweb object, it will be handled asynchronously. Any messages that come out of jweb from a call to window.max.outlet will always be handled on the low-priority queue.
Receiving Messages
Use the bindInlet function to receive messages from Max inside a JavaScript callback.
window.max.bindInlet("something", () => {
    /*
     * code here will be executed whenever jweb receives
     * the symbol "something"
     */
});
The bindInlet function can also register a callback that will accept arguments.
window.max.bindInlet("addNumbers", (a, b) => {
    console.log(`${a} plus ${b} is ${a + b}`);
});
You can use the spread operator to handle lists, or messages with a variable number of arguments.
window.max.bindInlet("printLength", (...values) => {
    console.log(`The list has ${values.length} elements`);
});
Sending Messages
Use the outlet function to send messages to the outlet of the jweb object.
// output a string
window.max.outlet("foo");

// output a list
window.max.outlet("foo", 1, 2);

// output contents of array with prepended "foo" message
let ar = [1, 2, 3, 4];
window.max.outlet.apply(window.max, ["foo"].concat(ar));
You can also send a message out of jweb using the href attribute of an anchor tag. Note that a message send this way will be output with the symbol "maxmessage" prepended. The contents of the message should be separated by the "/" character.
<a href="maxmessage:name/param1/param2">
Interacting with Max Dictionaries
Use getDict to get the contents of a Max dictionary.
let nestedValue;

// access dictionary
window.max.getDict("dictName", (dict) => {
    // dict is a JavaScript object. Dictionary keys
    // will be JavaScript object properties, so you
    // can fetch values using typical JavaScript syntax.
    nestedValue = dict.a;
});
Use setDict to set the contents of a dictionary.
let obj = {
    a : "1",
    b : "2",
    c : "3"
};

window.max.setDict("dictName", obj);
There is no special function to change just one value of a dictionary. To update a dictionary, call getDict followed by setDict.
window.max.getDict("dictName", (dict) => {
    // Increment a numerical value
    dict.inc = dict.inc + 1;

    window.max.setDict("dictName", dict);
})
Debugging
You can debug a webpage loaded in jweb using Google Chrome. After you open a remote debugging port in Max, each jweb instance will be visible as a separate device in the Chrome debugger. When you open the instance in Chrome, you'll be able to view the JavaScript console, set breakpoints, and monitor network traffic.
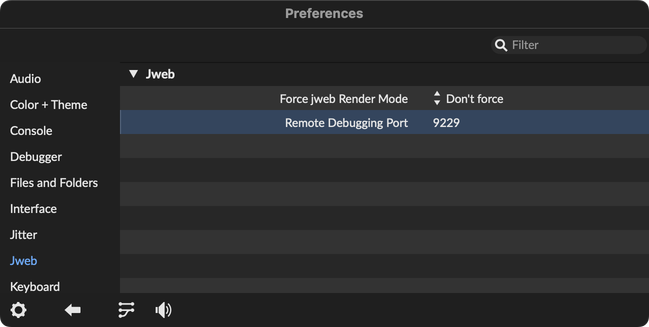
First, make sure to enable a debug port in Max. From Max's preferences, enable remote debugging by picking a port. Chrome defaults to browsing devices on port 9222 and 9229, so these are good choices.

You'll need to restart Max for these changes to take effect.
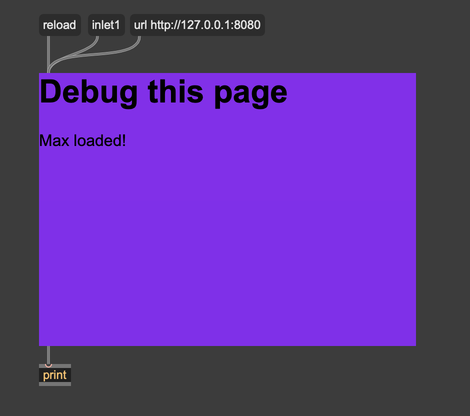
Now, load the webpage you want to debug in jweb.

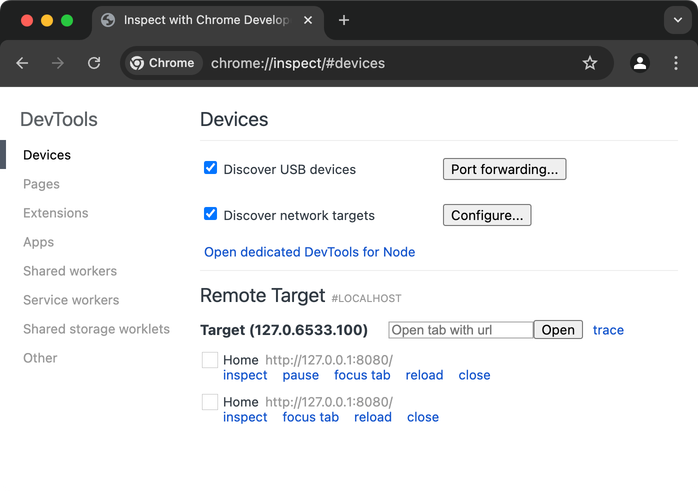
With the webpage loaded in jweb, open Chrome and navigate to chrome://inspect/#devices.

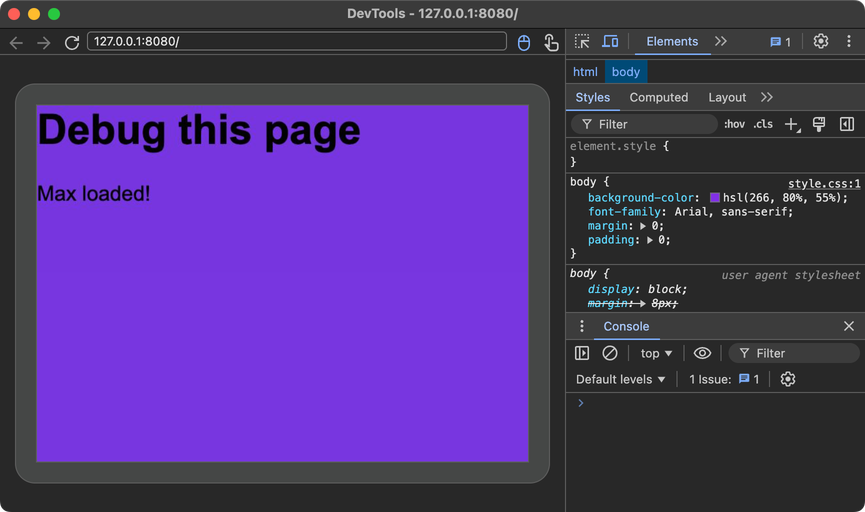
Click "inspect" under the page that you want to debug. Chrome will open a new window to debug your page. (If you don't see your jweb instance listed, it might be because you set Max to a jweb debug port other than 9222 or 9229. Click Configure... to enable your desired port.)

From here, you can debug this webpage just like you would any other. Look for guides releated to web development and JavaScript programming for more information.