How Digital Audio Works
A thorough explanation of how digital audio works is well beyond the scope of this manual. What follows is a very brief explanation that will give you the minimum understanding necessary to use MSP successfully.
For a more complete explanation of how digital audio works, we recommend The Computer Music Tutorial by Curtis Roads, published in 1996 by the MIT Press. It also includes an extensive bibliography on the subject.
Sound
Simple harmonic motion
The sounds we hear are fluctuations in air pressure - tiny variations from normal atmospheric pressure - caused by vibrating objects. (Well, technically it could be water pressure if you're listening underwater, but please keep your computer out of the swimming pool.)
As an object moves, it displaces air molecules next to it, which in turn displace air molecules next to them, and so on, resulting in a momentary ‘high pressure front’ that travels away from the moving object (toward your ears). So, if we cause an object to vibrate - we strike a tuning fork, for example - and then measure the air pressure at some nearby point with a microphone, the microphone will detect a slight rise in air pressure as the ‘high pressure front’ moves by. Since the tine of the tuning fork is fairly rigid and is fixed at one end, there is a restoring force pulling it back to its normal position, and because this restoring force gives it momentum it overshoots its normal position, moves to the opposite extreme position, and continues vibrating back and forth in this manner until it eventually loses momentum and comes to rest in its normal position. As a result, our microphone detects a rise in pressure, followed by a drop in pressure, followed by a rise in pressure, and so on, corresponding to the back and forth vibrations of the tine of the tuning fork.
If we were to draw a graph of the change in air pressure detected by the microphone over time, we would see a sinusoidal shape (a sine wave) rising and falling, corresponding to the back and forth vibrations of the tuning fork.
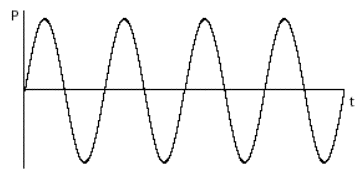
Sinusoidal change in air pressure caused by a simple vibration back and forth
This continuous rise and fall in pressure creates a wave of sound. The amount of change in air pressure, with respect to normal atmospheric pressure, is called the wave's amplitude (literally, its ‘bigness’). We most commonly use the term ‘amplitude’ to refer to the peak amplitude, the greatest change in pressure achieved by the wave.
This type of simple back and forth motion (seen also in the swing of a pendulum) is called simple harmonic motion. It's considered the simplest form of vibration because the object completes one full back-and-forth cycle at a constant rate. Even though its velocity changes when it slows down to change direction and then gains speed in the other direction - as shown by the curve of the sine wave - its average velocity from one cycle to the next is the same. Each complete vibratory cycle therefore occurs in an equal interval of time (in a given period of time), so the wave is said to be periodic. The number of cycles that occur in one second is referred to as the frequency of the vibration. For example, if the tine of the tuning fork goes back and forth 440 times per second, its frequency is 440 cycles per second, and its period is 1/440 second per cycle.
In order for us to hear such fluctuations of pressure:
-
The fluctuations must be substantial enough to affect our tympanic membrane (eardrum), yet not so substantial as to hurt us. In practice, the intensity of the changes in air pressure must be greater than about 10-9times atmospheric pressure, but not greater than about 10-3times atmospheric pressure. You'll never actually need that information, but there it is. It means that the softest sound we can hear has about one millionth the intensity of the loudest sound we can bear. That's quite a wide range of possibilities.
-
The fluctuations must repeat at a regular rate fast enough for us to perceive them as a sound (rather than as individual events), yet not so fast that it exceeds our ability to hear it. Textbooks usually present this range of audible frequencies as 20 to 20,000 cycles per second (cps, also known as hertz, abbreviated Hz). Your own mileage may vary. If you are approaching middle age or have listened to too much loud music, you may top out at about 17,000 Hz or even lower.
Complex tones
An object that vibrates in simple harmonic motion is said to have a resonant mode of vibration— a frequency at which it will naturally tend to vibrate when set in motion. However, most real- world objects have several resonant modes of vibration, and thus vibrate at many frequencies at once. Any sound that contains more than a single frequency (that is, any sound that is not a simple sine wave) is called a complex tone. Let's take a stretched guitar string as an example.
A guitar string has a uniform mass across its entire length, has a known length since it is fixed at both ends (at the ‘nut’ and at the ‘bridge’), and has a given tension depending on how tightly it is tuned with the tuning peg. Because the string is fixed at both ends, it must always be stationary at those points, so it naturally vibrates most widely at its center.

The frequency at which it vibrates depends on its mass, its tension, and its length. These traits stay fairly constant over the course of a note, so it has one fundamental frequency at which it vibrates.
However, other modes of vibration are still possible.
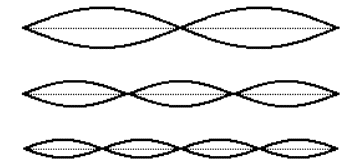
The possible modes of vibration are constrained by the fact that the string must remain stationary at each end. This limits its modes of resonance to integer divisions of its length.

Because the tension and mass are set, integer divisions of the string's length result in integer multiples of the fundamental frequency.
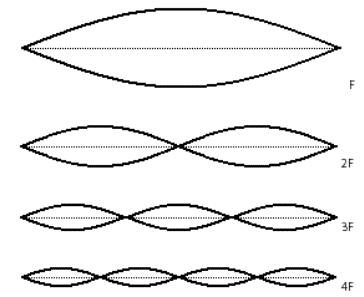
In fact, a plucked string will vibrate in all of these possible resonant modes simultaneously, creating energy at all of the corresponding frequencies. Of course, each mode of vibration (and thus each frequency) will have a different amplitude. (In the example of the guitar string, the longer segments of string have more freedom to vibrate.) The resulting tone will be the sum of all of these frequencies, each with its own amplitude.
As the string's vibrations die away due to the damping force of the fixture at each end, each frequency may die away at a different rate. In fact, in many sounds the amplitudes of the different component frequencies may vary quite separately and differently from each other. This variety seems to be one of the fundamental factors in our perception of sounds as having different tone color (i.e., timbre), and the timbre of even a single note may change drastically over the course of the note.
Harmonic tones
The combination of frequencies - and their amplitudes - that are present in a sound is called its spectrum (just as different frequencies and intensities of light constitute a color spectrum). Each individual frequency that goes into the makeup of a complex tone is called a partial. (It's one part of the whole tone.)
When the partials (component frequencies) in a complex tone are all integer multiples of the same fundamental frequency, as in our example of a guitar string, the sound is said to have a harmonic spectrum. Each component of a harmonic spectrum is called a harmonic partial, or simply a harmonic. The sum of all those harmonically related frequencies still results in a periodic wave having the fundamental frequency. The integer multiple frequencies thus fuse ‘harmoniously’ into a single tone.
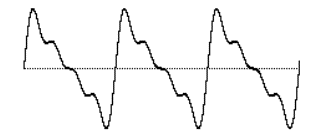
This fusion is supported by the famous mathematical theorem of Jean-Baptiste Joseph Fourier, which states that any periodic wave, no matter how complex, can be demonstrated to be the sum of different harmonically related frequencies (sinusoidal waves), each having its own amplitude and phase. (Phase is an offset in time by some fraction of a cycle.)
Harmonically related frequencies outline a particular set of related pitches in our musical perception.

Each time the fundamental frequency is multiplied by a power of 2 - 2, 4, 8, 16, etc. - the perceived musical pitch increases by one octave. All cultures seem to share the perception that there is a certain ‘sameness’ of pitch class between such octave-related frequencies. The other integer multiples of the fundamental yield new musical pitches. Whenever you're hearing a harmonic complex tone, you're actually hearing a chord! As we've seen, though, the combined result repeats at the fundamental frequency, so we tend to fuse these frequencies together such that we perceive a single pitch.
Inharmonic tones and noise
Some objects - such as a bell, for instance - vibrate in even more complex ways, with many different modes of vibrations which may not produce a harmonically related set of partials. If the frequencies present in a tone are not integer multiples of a single fundamental frequency, the wave does not repeat periodically. Therefore, an inharmonic set of partials does not fuse together so easily in our perception. We may be able to pick out the individual partials more readily, and - especially when the partials are many and are completely inharmonic - we may not perceive the tone as having a single discernible fundamental pitch.
When a tone is so complex that it contains very many different frequencies with no apparent mathematical relationship, we perceive the sound as noise. A sound with many completely random frequencies and amplitudes - essentially all frequencies present in equal proportion - is the static-like sound known as white noise (analogous to white light which contains all frequencies of light).
So, it may be useful to think of sounds as existing on a continuum from total purity and predictability (a sine wave) to total randomness (white noise). Most sounds are between these two extremes. An harmonic tone - a trumpet or a guitar note, for example - is on the purer end of the continuum, while a cymbal crash is closer to the noisy end of the continuum. Timpani and bells may be just sufficiently suggestive of a harmonic spectrum that we can identify a fundamental pitch, yet they contain other inharmonic partials. Other drums produce more of a band-limited noise - randomly related frequencies, but restricted within a certain frequency range - giving a sense of pitch range, or non-specific pitch, rather than an identifiable fundamental. It is important to keep this continuum in mind when synthesizing sounds.
Amplitude envelope
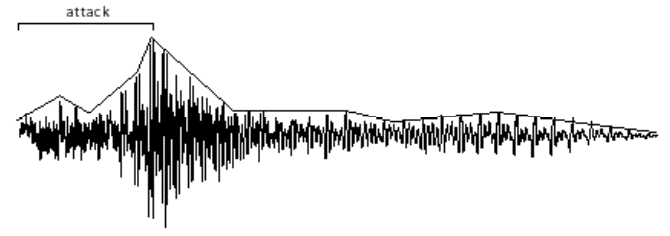
Another important factor in the nearly infinite variety of sounds is the change in over-all amplitude of a sound over the course of its duration. The shape of this macroscopic over-all change in amplitude is termed the amplitude envelope. The initial portion of the sound, as the amplitude envelope increases from silence to audibility, rising to its peak amplitude, is known as the attack of the sound. The envelope, and especially the attack, of a sound are important factors in our ability to distinguish, recognize, and compare sounds. We have very little knowledge of how to read a graphic representation of a sound wave and hear the sound in our head the way a good sight reader can do with musical notation.
However, the amplitude envelope can at least tell us about the general evolution of the loudness of the sound over time.
Amplitude and loudness
The relationship between the objectively measured amplitude of a sound and our subjective impression of its loudness is very complicated and depends on many factors. Without trying to explain all of those factors, we can at least point out that our sense of the relative loudness of two sounds is related to the ratio of their intensities, rather than the mathematical difference in their intensities. For example, on an arbitrary scale of measurement, the relationship between a sound of amplitude 1 and a sound of amplitude 0.5 is the same to us as the relationship between a sound of amplitude 0.25 and a sound of amplitude 0.125. The subtractive difference between amplitudes is 0.5 in the first case and 0.125 in the second case, but what concerns us perceptually is the ratio, which is 2:1 in both cases.
Does a sound with twice as great an amplitude sound twice as loud to us? In general, the answer is ‘no’. First of all, our subjective sense of ‘loudness’ is not directly proportional to amplitude. Experiments find that for most listeners, the (extremely subjective) sensation of a sound being ‘twice as loud’ requires a much greater than twofold increase in amplitude. Furthermore, our sense of loudness varies considerably depending on the frequency of the sounds being considered. We're much more sensitive to frequencies in the range from about 300 Hz to 7,000 Hz than we are to frequencies outside that range. (This might possibly be due evolutionarily to the importance of hearing speech and many other important sounds which lie mostly in that frequency range.)
Nevertheless, there is a correlation - even if not perfectly linear - between amplitude and loudness, so it's certainly informative to know the relative amplitude of two sounds. As mentioned earlier, the softest sound we can hear has about one millionth the amplitude of the loudest sound we can bear. Rather than discuss amplitude using such a wide range of numbers from 0 to 1,000,000, it is more common to compare amplitudes on a logarithmic scale.
The ratio between two amplitudes is commonly discussed in terms of decibels (abbreviated dB). A level expressed in terms of decibels is a statement of a ratio relationship between two values - not an absolute measurement. If we consider one amplitude as a reference which we call A0, then the relative amplitude of another sound in decibels can be calculated with the equation:
level in decibels = 20 log10 (A/A<sub>0</sub>)
If we consider the maximum possible amplitude as a reference with a numerical value of 1, then a sound with amplitude 0.5 has1/2 the amplitude (equal to 10-0.3) so its level is
20 log10 (0.5/1) = 20 (-0.3) = -6 dB
Each halving of amplitude is a difference of about -6 dB; each doubling of amplitude is an increase of about 6 dB. So, if one amplitude is 48 dB greater than another, one can estimate that it's about 28 (256) times as great.
Notes
A theoretical understanding of sine waves, harmonic tones, inharmonic complex tones, and noise, as discussed here, is useful to understanding the nature of sound. However, most sounds are actually complicated combinations of these theoretical descriptions, changing from one instant to another. For example, a bowed string might include noise from the bow scraping against the string, variations in amplitude due to variations in bow pressure and speed, changes in the prominence of different frequencies due to bow position, changes in amplitude and in the fundamental frequency (and all its harmonics) due to vibrato movements in the left hand, etc. A drum note may be noisy but might evolve so as to have emphases in certain regions of its spectrum that imply a harmonic tone, thus giving an impression of fundamental pitch. Examination of existing sounds, and experimentation in synthesizing new sounds, can give insight into how sounds are composed. The computer provides that opportunity.
Digital representation of sound
Sampling and quantizing a sound wave
To understand how a computer represents sound, consider how a film represents motion. A movie is made by taking still photos in rapid sequence at a constant rate, usually twenty-four frames per second. When the photos are displayed in sequence at that same rate, it fools us into thinking we are seeing continuous motion, even though we are actually seeing twenty-four discrete images per second. Digital recording of sound works on the same principle. We take many discrete samples of the sound wave's instantaneous amplitude, store that information, then later reproduce those amplitudes at the same rate to create the illusion of a continuous wave.
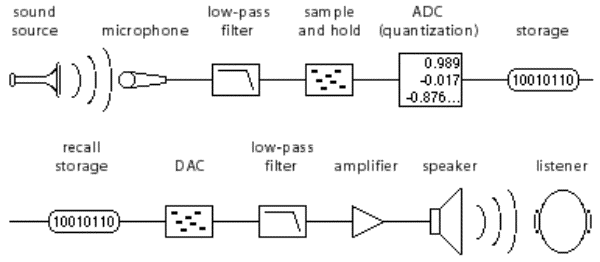
The job of a microphone is to transduce (convert one form of energy into another) the change in air pressure into an analogous change in electrical voltage. This continuously changing voltage can then be sampled periodically by a process known as sample and hold. At regularly spaced moments in time, the voltage at that instant is sampled and held constant until the next sample is taken. This reduces the total amount of information to a certain number of discrete voltages.

A device known as an analog-to-digital converter (ADC) receives the discrete voltages from the sample and hold device, and ascribes a numerical value to each amplitude. This process of converting voltages to numbers is known as quantization. Those numbers are expressed in the computer as a string of binary digits (1 or 0). The resulting binary numbers are stored in memory — usually on a digital audio tape, a hard disk, or a laser disc. To play the sound back, we read the numbers from memory, and deliver those numbers to a digital-to-analog converter (DAC) at the same rate at which they were recorded. The DAC converts each number to a voltage, and communicates those voltages to an amplifier to increase the amplitude of the voltage.
In order for a computer to represent sound accurately, many samples must be taken per second— many more than are necessary for filming a visual image. In fact, we need to take more than twice as many samples as the highest frequency we wish to record. (For an explanation of why this is so, see the following section, Limitations of Digital Audio.) If we want to record frequencies as high as 20,000 Hz, we need to sample the sound at least 40,000 times per second. The standard for compact disc recordings (and for ‘CD-quality’ computer audio) is to take 44,100 samples per second for each channel of audio. The number of samples taken per second is known as the sampling rate.
This means the computer can only accurately represent frequencies up to half the sampling rate. Any frequencies in the sound that exceed half the sampling rate must be filtered out before the sampling process takes place. This is accomplished by sending the electrical signal through a low-pass filter which removes any frequencies above a certain threshold. Also, when the digital signal (the stream of binary digits representing the quantized samples) is sent to the DAC to be re-converted into a continuous electrical signal, the sound coming out of the DAC will contain spurious high frequencies that were created by the sample and hold process itself. (These are due to the ‘sharp edges’ created by the discrete samples, as seen in the above example.) Therefore, we need to send the output signal through a low-pass filter, as well.
The digital recording and playback process, then, is a chain of operations, as represented in the following diagram.
Limitations of digital audio
Sampling rate and Nyquist rate
We've noted that it's necessary to take at least twice as many samples as the highest frequency we wish to record. This was proven by Harold Nyquist, and is known as the Nyquist theorem. Stated another way, the computer can only accurately represent frequencies up to half the sampling rate. One half the sampling rate is often referred to as the Nyquist frequency or the Nyquist rate.
If we take, for example, 16,000 samples of an audio signal per second, we can only capture frequencies up to 8,000 Hz. Any frequencies higher than the Nyquist rate are perceptually ‘folded’ back down into the range below the Nyquist frequency. So, if the sound we were trying to sample contained energy at 9,000 Hz, the sampling process would misrepresent that frequency as 7,000 Hz - a frequency that might not have been present at all in the original sound. This effect is known as foldover or aliasing. The main problem with aliasing is that it can add frequencies to the digitized sound that were not present in the original sound, and unless we know the exact spectrum of the original sound there is no way to know which frequencies truly belong in the digitized sound and which are the result of aliasing. That's why it's essential to use the low-pass filter before the sample and hold process, to remove any frequencies above the Nyquist frequency.
To understand why this aliasing phenomenon occurs, think back to the example of a film camera, which shoots 24 frames per second. If we're shooting a movie of a car, and the car wheel spins at a rate greater than 12 revolutions per second, it's exceeding half the ‘sampling rate’ of the camera. The wheel completes more than1/2revolution per frame. If, for example it actually completes18/24of a revolution per frame, it will appear to be going backward at a rate of 6 revolutions per second. In other words, if we don't witness what happens between samples, a 270° revolution of the wheel is indistinguishable from a -90° revolution. The samples we obtain in the two cases are precisely the same.

For audio sampling, the phenomenon is practically identical. Any frequency that exceeds the Nyquist rate is indistinguishable from a negative frequency the same amount less than the Nyquist rate. (And we do not distinguish perceptually between positive and negative frequencies.) To the extent that a frequency exceeds the Nyquist rate, it is folded back down from the Nyquist frequency by the same amount.
For a demonstration, consider the next two examples. The following example shows a graph of a 4,000 Hz cosine wave (energy only at 4,000 Hz) being sampled at a rate of 22,050 Hz. 22,050 Hz is half the CD sampling rate, and is an acceptable sampling rate for sounds that do not have much energy in the top octave of our hearing range.
In this case the sampling rate is quite adequate because the maximum frequency we are trying to record is well below the Nyquist frequency.

Now consider the same 4,000 Hz cosine wave sampled at an inadequate rate, such as 6,000 Hz. The wave completes more than1/2cycle per sample, and the resulting samples are indistinguishable from those that would be obtained from a 2,000 Hz cosine wave.

The simple lesson to be learned from the Nyquist theorem is that digital audio cannot accurately represent any frequency greater than half the sampling rate. Any such frequency will be misrepresented by being folded over into the range below half the sampling rate.
Precision of quantization
Each sample of an audio signal must be ascribed a numerical value to be stored in the computer. The numerical value expresses the instantaneous amplitude of the signal at the moment it was sampled. The range of the numbers must be sufficiently large to express adequately the entire amplitude range of the sound being sampled.
The range of possible numbers used by a computer depends on the number of binary digits (bits) used to store each number. A bit can have one of two possible values: either 1 or 0. Two bits together can have one of four possible values: 00, 01, 10, or 11. As the number of bits increases, the range of possible numbers they can express increases by a power of two. Thus, a single byte (8 bits) of computer data can express one of 28= 256 possible numbers. If we use two bytes to express each number, we get a much greater range of possible values because 216 = 65,536.
The number of bits used to represent the number in the computer is important because it determines the resolution with which we can measure the amplitude of the signal. If we use only one byte to represent each sample, then we must divide the entire range of possible amplitudes of the signal into 256 parts since we have only 256 ways of describing the amplitude.

For example, if the amplitude of the electrical signal being sampled ranges from -10 volts to +10 volts and we use one byte for each sample, each number does not represent a precise voltage but rather a 0.078125 V portion of the total range. Any sample that falls within that portion will be ascribed the same number. This means each numerical description of a sample's value could be off from its actual value by as much as 0.078125V -1/256of the total amplitude range. In practice each sample will be off by some random amount from 0 to1/256of the total amplitude range. The mean error will be1/512of the total range.
This is called quantization error. It is unavoidable, but it can be reduced to an acceptable level by using more bits to represent each number. If we use two bytes per sample, the quantization error will never be greater than1/65,536of the total amplitude range, and the mean error will be1/131,072.
Since the quantization error for each sample is usually random (sometimes a little too high, sometimes a little too low), we generally hear the effect of quantization error as white noise. This noise is not present in the original signal. It is added into the digital signal by the imprecise nature of quantization. This is called quantization noise.
The ratio of the total amplitude range to the quantization error is called the signal-to-quantization- noise-ratio (SQNR). This is the ratio of the maximum possible signal amplitude to the average level quantization of the quantization noise, and is usually stated in decibels.
As a rule of thumb, each bit of precision used in quantization adds 6 dB to the SQNR. Therefore, sound quantized with 8-bit numerical precision will have a best case SQNR of about 48 dB. This is adequate for cases where fidelity is not important, but is certainly not desirable for music or other critical purposes. Sound sampled with 16-bit precision (‘CD-quality’) has a SQNR of 96 dB, which is quite good - it is much quieter than typical listening rooms.
In short, the more bits used by the computer to store each sample, the better the potential ratio of signal to noise.
Memory and storage
We have seen that the standard sampling rate for high-fidelity audio is 44,100 samples per second. We've also seen that 16 bits (2 bytes) are needed per sample to achieve a good signal-to-noise ratio. With this information we can calculate the amount of data needed for digital audio: 44,100 samples per second, times 2 bytes per sample, times 2 channels for stereo, times 60 seconds per minute equals more than 10 megabytes of data per minute of CD-quality audio. Clearly, the memory and storage requirements of digital audio are substantial. Fortunately, a compact disc holds over an hour of stereo sound, and a computer hard disk of anything over a gigabyte is adequate for most audio recording and processing.
Clipping
If the amplitude of the incoming electrical signal exceeds the maximum amplitude that can be expressed numerically, the digital signal will be a clipped-off version of the actual sound.

The clipped sample will often sound quite different from the original. Sometimes this type of clipping causes only a slight distortion of the sound that is heard as a change in timbre. More often though, it sounds like a very unpleasant noise added to the sound. For this reason, it's very important to take precautions to avoid clipping. The amplitude of the electrical signal should not exceed the maximum expected by the ADC.
It's also possible to produce numbers in the computer that exceed the maximum expected by the DAC. This will cause the sound that comes out of the DAC to be a clipped version of the digital signal. Clipping by the DAC is just as bad as clipping by the ADC, so care must be taken not to generate a digital signal that goes beyond the numerical range the DAC is capable of handling.
Advantages of digital audio
Synthesizing digital audio
Since a digital representation of sound is just a list of numbers, any list of numbers can theoretically be considered a digital representation of a sound. In order for a list of numbers to be audible as sound, the numerical values must fluctuate up and down at an audio rate. We can listen to any such list by sending the numbers to a DAC where they are converted to voltages. This is the basis of computer sound synthesis. Any numbers we can generate with a computer program, we can listen to as sound.
Many methods have been discovered for generating numbers that produce interesting sounds. One method of producing sound is to write a program that repeatedly solves a mathematical equation containing two variables. At each repetition, a steadily increasing value is entered for one of the variables, representing the passage of time. The value of the other variable when the equation is solved is used as the amplitude for each moment in time. The output of the program is an amplitude that varies up and down over time.
For example, a sine wave can be produced by repeatedly solving the following algebraic equation, using an increasing value for n :
y = A sin(2πƒn/R+ø)
where A is the amplitude of the wave, ƒ is the frequency of the wave, n is the sample number (0,1, 2,3, etc.), R is the sampling rate, and ø is the phase. If we enter values for A, ƒ,and y while increasing the value of n, the value of y (the output sample) will vary sinusoidally.
A complex tone can be produced by adding sinusoids - a method known as additive synthesis :
y = A1 sin(2πƒ1n/R+ø1) + A2 sin(2πƒ2n/R+ø2) + ...
This is an example of how a single algebraic expression can produce a sound. Naturally, many other more complicated programs are possible. A few synthesis methods such as additive synthesis, wavetable synthesis, frequency modulation, and waveshaping are demonstrated in the MSP Tutorial.
Manipulating digital signals
Any sound in digital form - whether it was synthesized by the computer or was quantized from a ‘real world’ sound - is just a series of numbers. Any arithmetic operation performed with those numbers becomes a form of audio processing.
For example, multiplication is equivalent to audio amplification. Multiplying each number in a digital signal by 2 doubles the amplitude of the signal (increases it 6 dB). Multiplying each number in a signal by some value between 0 and 1 reduces its amplitude.
Addition is equivalent to audio mixing. Given two or more digital signals, a new signal can be created by adding the first numbers from each signal, then the second numbers, then the third numbers, and so on.
An echo can be created by recalling samples that occurred earlier and adding them to the current samples. For example, whatever signal was sent out 1000 samples earlier could be sent out again, combined with the current sample.
y = xn + A yn-1000
As a matter of fact, the effects that such operations can have on the shape of a signal (audio or any other kind) are so many and varied that they comprise an entire branch of electrical engineering called digital signal processing (DSP). DSP is concerned with the effects of digital filters - formulae for modifying digital signals by combinations of delay, multiplication, addition, and other numerical operations.
Summary
This chapter has described how the continuous phenomenon of sound can be captured and faithfully reproduced as a series of numbers, and ultimately stored in computer memory as a stream of binary digits. There are many benefits obtainable only by virtue of this digital representation of sound: higher fidelity recording than was previously possible, synthesis of new sounds by mathematical procedures, application of digital signal processing techniques to audio signals, etc.
MSP provides a toolkit for exploring this range of possibilities. It integrates digital audio recording, synthesis, and processing with the MIDI control and object-based programming of Max.