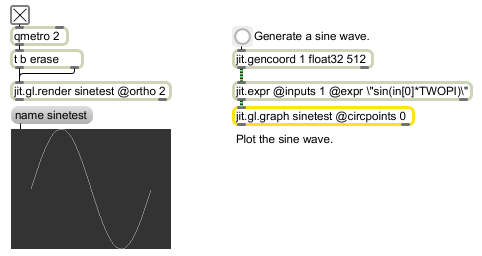
Examples

Open GL floating-point data visualization
| Name | Type | g/s | Description |
|---|---|---|---|
| circpoints | int | The number of circumference points to render for each cylidrical slice. For example, a value of 1 will render a line, a value of 2 will render a planar area, a value of 3 will render the geometry using triangular prisms, etc. | |
| radial | int | Toggles radial mode enable/disable. When enabled, the incoming data is visualized about the circumference of a circle. | |
| radialphase | float | Sets a phase offset when radial mode is enabled. | |
| radialradius | float | Sets the radius when radial mode is enabled |

| Name | Description |
|---|---|
| jit.buffer~ | A matrix-friendly MSP buffer~ |
| jit.catch~ | Transforms signal data into matrices |
| jit.gl.gridshape | Generate simple geometric shapes as a connected grid |
| jit.gl.handle | Use mouse movement to control position/rotation |
| jit.gl.isosurf | Generates a GL based surface extraction |
| jit.gl.mesh | Generates GL geometry from existing data |
| jit.gl.model | Read and draw Wavefront .obj models |
| jit.gl.nurbs | Generate NURBS surface |
| jit.gl.plato | Generate platonic solids |
| jit.gl.render | Render Open GL |
| jit.gl.shader | Manages a GL shader |
| jit.gl.sketch | GL parallel to lcd |
| jit.gl.slab | Performs a GL accelerated grid-based evaluation |
| jit.gl.text2d | Write bitmap text |
| jit.gl.text3d | Write vector text |
| jit.gl.texture | Manages a GL texture |
| jit.gl.videoplane | GL accelerated video plane |
| jit.gl.volume | Creates a GL accelerated volume vizualization |
| jit.graph | Floating-point data visualization |
| jit.plot | (x,y) plotting of a two-plane matrix |