Patcher Toolbars
The top, left, right, and bottom of every Max window contain the toolbars. These icons allow you to access built-in Max content, configure the behavior of your patcher, quickly access objects to add to your patcher, and more.
Customizing Toolbars
If you want, you can pin/unpin any of the toolbars by hovering over the toolbar and clicking on the triangular tab that appears in the middle of the toolbar. Hover over the hidden toolbar, near the border of the patcher, to bring the toolbar back.

You can also customize each toolbar by adding or removing icons. To remove an icon, simply right-click on it and choose the Remove option from the contextual menu.
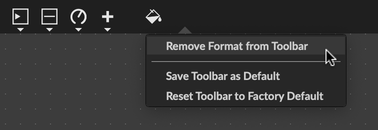
You can also add icons to your toolbars by right-clicking and selecting an Add option from the contextual menu. Each toolbar has different options for which icons can be added.
- Right Toolbar- Select Add Browse Lessons to add a lesson browser.
- Bottom Toolbar- This toolbar can add Mute and Solo buttons, which mute and solo the audio output of the patcher.
- Left Toolbar- The most customizable of all, since you can add a browse icon for any installed package to this toolbar. You can also add an icon to open the Package Manager.
If you want your toolbars to keep their configuration the next time you open Max, right-click and select Save Toolbar as Default. If you want to go back to the original toolbar configuration, select Reset Toolbar to Factory Default.
Left toolbar
The left toolbar provides access to different collections of resources that you can use in your patcher. For a more detailed, dedicated view of all the files in Max's search path, use the File Browser.
From top to bottom:
- Patcher List View- List, sort, and filter all of the objects in the current patcher.
- Objects- Browse and filter all the objects in Max, including objects from installed packages.
- Audio- Contains all the audio in Max's search path, with options to filter by name and length.
- Video- Browse all the videos in Max's search path.
- Images- Browse all the images in Max's search path.
- Plug-ins- Displays both VST and Audio Unit plug-ins, as well as Max for Live devices (also known as AMXDs).
- Max for Live- Special snippets and objects for Max for Live device development.
- Modules- Categorized selections of objects and snippets from installed packages
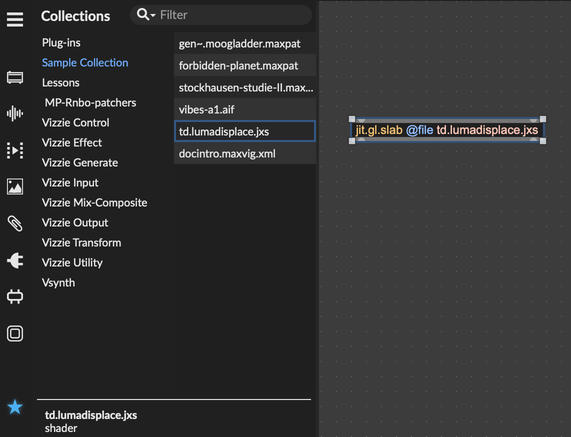
- Collections- Resources from collections as defined in the File Browser.
Optionally, you can also add a browser view for Gen DSP, Gen Jitter, or any installed package.
Patcher List View
The Patcher List View, which only functions when the patcher is unlocked, shows all of the objects in the current patcher. Unlike the patcher view itself, which shows each object in its current patching rectangle, this view simply displays the text of each object in a flat list.
The list view is helpful for locating, selecting, and operating on objects that might otherwise hard to find in complex patchers.
Move the cursor over any element in the list to highlight the associated object, and click to select it.
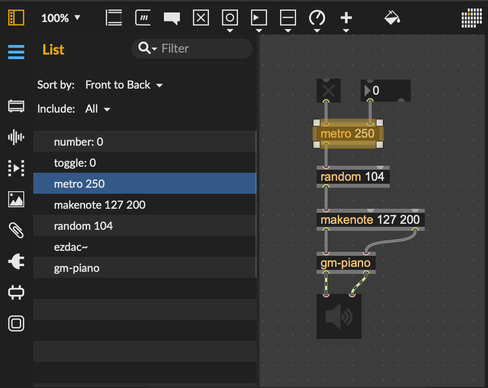
Objects within a subpatcher won't be included in the list, but you can double-click on a subpatcher object to open that subpatcher.
Type in the Filter text entry at the top of the view to filter for objects matching specific text.
Use the Sort by drop-down to change how objects are sorted in the list, and use the Include drop-down to filter for UI Objects, Non-UI Objects, or All Objects.
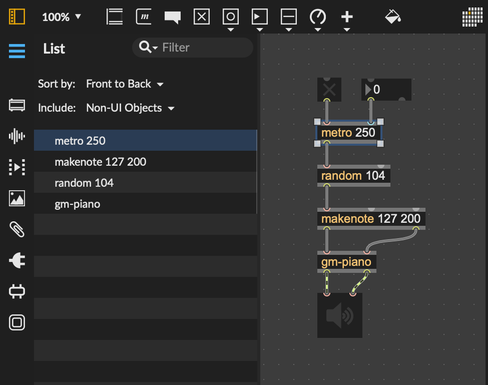
When open, the list view will reflect the current selection in the patcher window. In addition, the list view display of objects with values such as slider or number will update as the values of those objects changes.
Operations on List View Items
-
Click any item to select it in the patcher. Shift-click to select multiple items.
-
Click on the round button that appears at the left edge of a list view item to open the Object Action Menu for the object.

-
Double-click on any list view item to perform the same action as double-clicking on the item in the patcher would perform. For instance, double-clicking on a patcher will open the object's patcher window.
-
Press return or enter on any selected object to send that object a
bangmessage. For example, selecting a button and pressing return will act as if you clicked on the button.
Dragging and Dropping
The following browsers, including the Object Browser, Audio Browser, etc., are convenient ways to find resources that you can add to your patch. Once you've found what you're looking for, you can just drag the resource into your patch to add it.
Depending on what kind of resource you're trying to add, the Max patcher will handle the drop in different ways. If you drag an audio file into your patch, Max will create a playlist~ object to play that file back. If you drag in a video file, Max will make a jit.playlist object.

Some resources can give you multiple options as to how they should be handled. Hold down Alt (Windows) or Option (macOS) while dragging a resource into the patcher view to see all the available options.

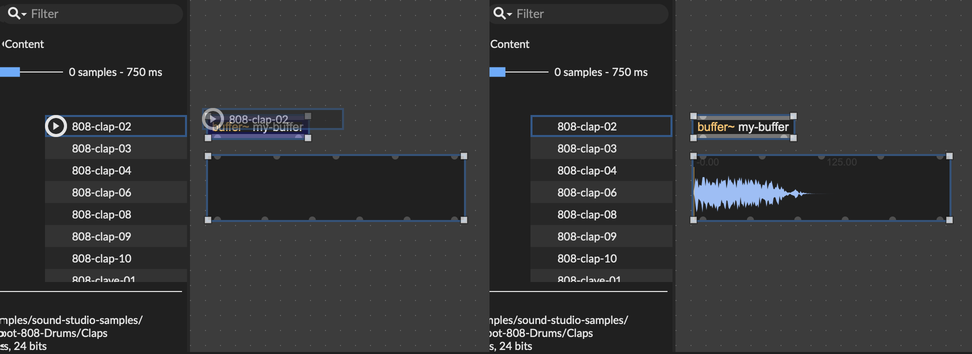
Finally, many Max object can handle resources of the appropriate kind. For example, if you drag an audio file over a buffer~ object, you'll see a blue border appear inside buffer~, indicating that it can perform a special action when you drop the file. Usually, if an object can load a file in response to an open or read message, then it can handle a drag-and-drop action with that same file type.
Object Browser
The Object Browser shows you all the objects that Max has to offer, with a couple of controls to make it easier to find the object you're looking for.
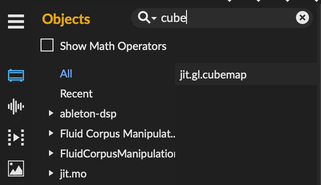
Type into the Filter text entry at the top to find objects matching specific text.
Max has several Math Operators, small objects that perform a simple math operation like addition or multiplication. By default, these objects are filtered from view, but you can select the Show Math Operators checkbox to reveal them.
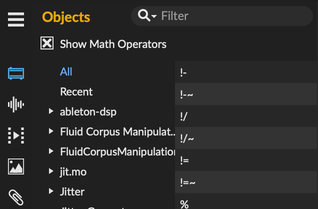
The browser view on the left groups objects by package, and then by category within a package. Click on a package to show all objects included in that package, and on a category to show just objects in that category.
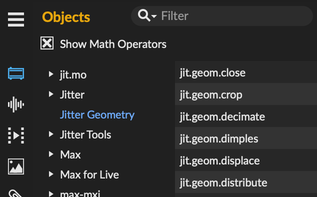
Finally, notice the description view at the bottom of the browser, which will show a short summary when you roll over an object.

Audio Browser
The Audio Browser shows all of the audio samples in Max's search path. There are controls to filter by name and length, and a preview option to audition samples as well.
Type into the Filter text entry at the top to find objects matching specific text.
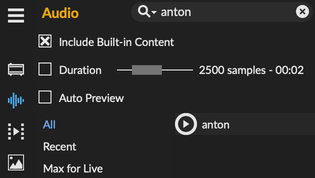
You can deselect Include Built-in Content to filter out any content that shipped with Max. This includes content from built-in packages, like BEAP and Jitter.
With the Duration filter active, you can use the slider to select only audio files that fall within a certain length.
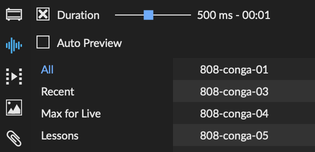
Hover over a sample and click the Play triangle to preview the sample. While the sample is playing, the triangle will change to a Pause icon that you can use to pause playback.
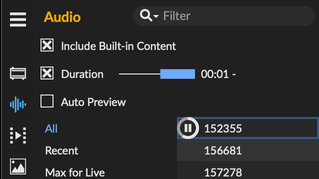
If Auto Preview is enabled, each sound sample will start playing as soon as you select it. With this option, you can use the arrow keys to move your selection up and down, quickly auditioning a large number of files.
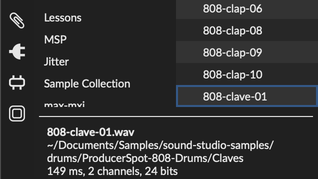
Finally,the Description view at the bottom of the browser will display the name of an audio file, the full path to that file on disk, the length of the file, the number of audio channels in the file, and the bit depth of samples in the file.
Video Browser
The Video Browser shows all of the video files in Max's search path. There are controls to filter by name, and you can choose whether to view files as a list or by preview thumbnails.
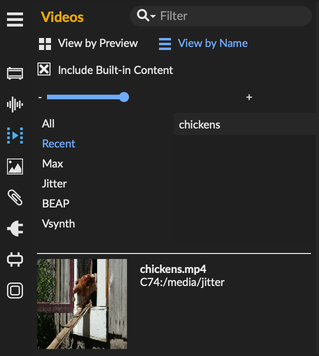
With View by Preview enabled, video files will appear in a grid of video thumbnails. Hover over a thumbnail to see the name of the file, and click on it to preview the video. Finally, use the size controller above the thumbnails to adjust the size of the previews in the view.
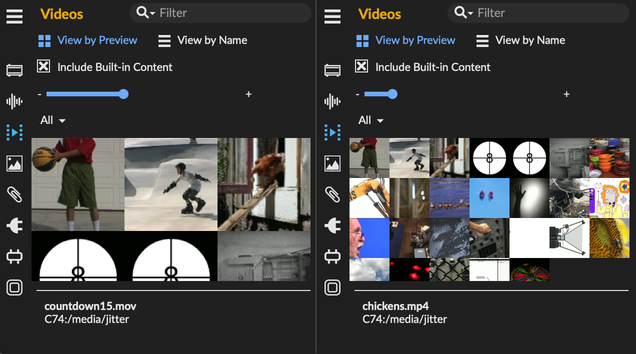
Image Browser
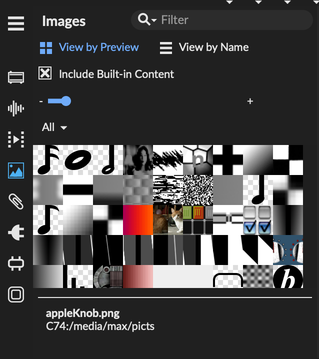
The Image Browser shows all of the image files in Max's search path. Similar to the Video Browser, there are controls to filter by name, and you can choose whether to view files as a list or by preview thumbnails.
Snippet Browser
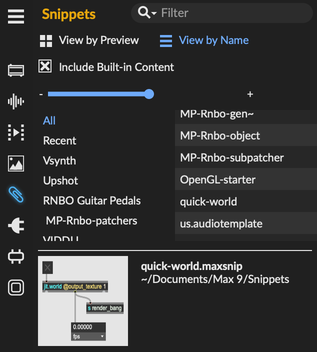
The Snippet Browser shows you all of the Snippets that Max has access to. Like the Video and Image Browsers, there are controls to filter by name, and you can choose whether to view files as a list or by preview thumbnails.
Plug-ins Browser
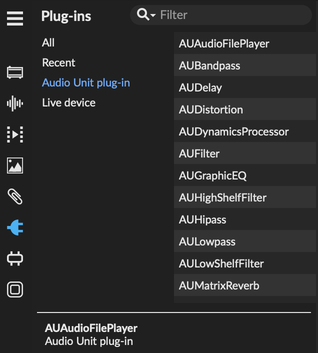
The Plug-ins Browser shows you both VSTs and Audio Units plug-ins that Max has scanned, as well as any Max for Live devices (AMXDs) in the search path. Use the Filter text entry to filter by name, and the Recent tab so see plug-ins that you've used recently.
Max for Live Browser
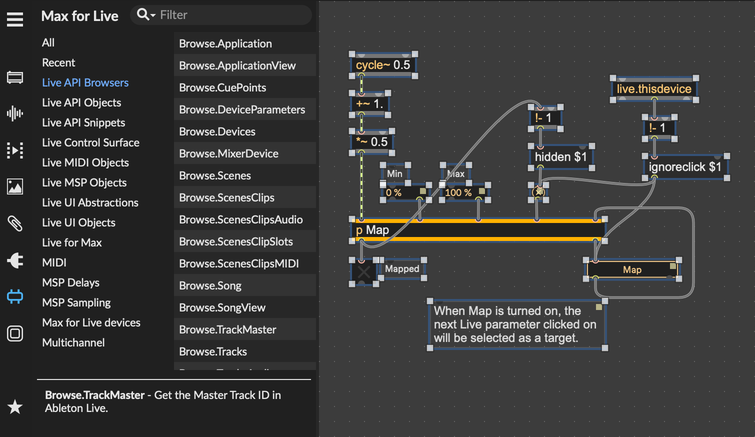
The Max for Live Browser is organized to make Max for Live device development easier by bringing together objects, abstractions, and snippets for common tasks like handling MIDI, voice allocation, and audio synthesis. The snippets and abstractions under Live API Browsers, Live API Snippets and Live API Objects are especially useful, since these provide solutions to many of the common programming challenges you'll run into when working with the Live API
Module Browser
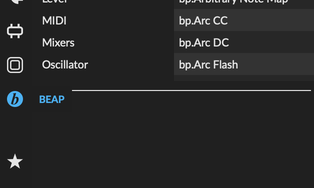
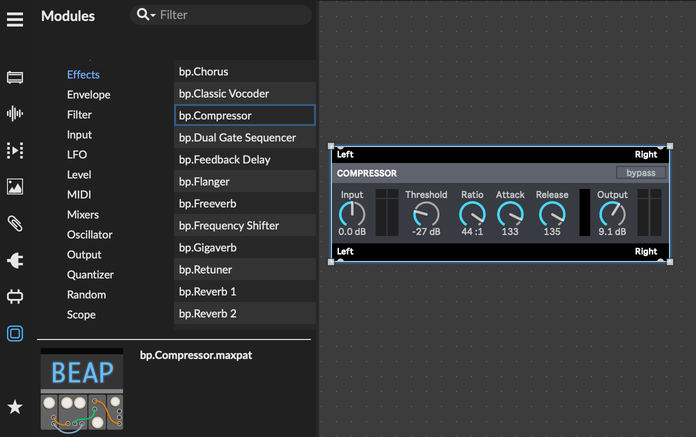
The Modules Browser presents snippets and abstractions from built-in and third party packages that you've installed. It's a powerful way to package authors to give you quick access to the best of what their tools are capable of. For example, the built-in BEAP package has categorized abstractions related to audio analysis, effects, and quantization, all organized into modules.
Collection Browser
The Collection Browser shows you all the collections that you've defined using the File Browser. Collections give you total control over how your work is grouped, since a single collections can contain any kind of resource, including video clips, text files, and JavaScript code. You can define collections specific to a project or workflow, and use the Collections Browser to quickly access resources in that collection.
Top toolbar
The top toolbar contains various controls for changing the appearance of your patcher, along with quick access to many of the user interface objects available in Max.

The Show Browser icon reveals the most recent Browser view in the Left Toolbar.
The Zoom Dropdown lets you adjust the level of zoom in your Max patcher. You can also adjust the zoom level by pressing ⌘= (macOS) or CTRL= (Windows) to zoom in, and ⌘- (macOS)or CTRL- (Windows) to zoom out.
The UI Object Palette gives you quick access to Max UI objects, organized by function. Click on icons with a disclosure triangle to see a selection of options within that category.

The Format Palette button lets you adjust the style and appearance of objects in your patcher.

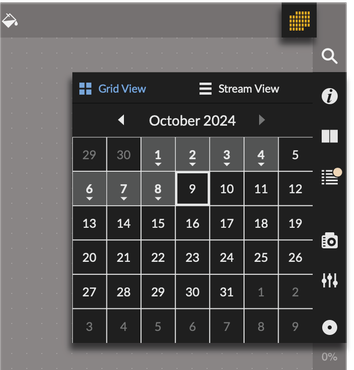
Finally, the calendar button lets you access the calendar. This can be extremely useful when you want to know what patches you opened on a specific date.
Right toolbar
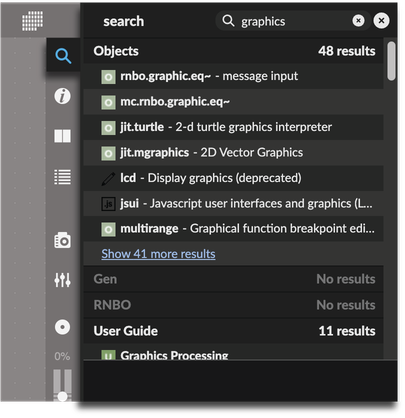
The right toolbar lets you access the sidebar. Each button icon opens a different sidebar view. The Search icon lets you access Max's search, which can help you find objects, reference documentation, examples, and forum posts.
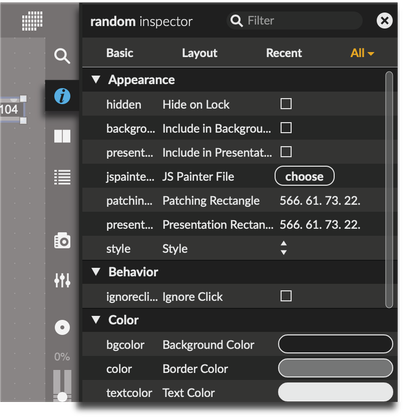
The Inspector icon will open the patcher and object inspector, which lets you view and edit the configuration of the objects in your patcher.
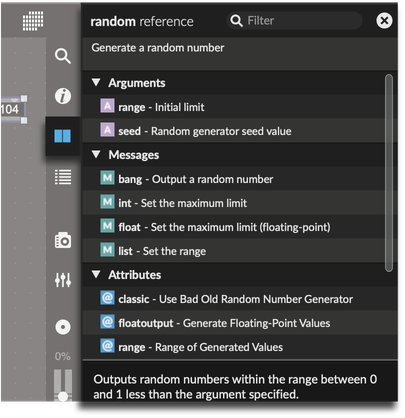
The Reference Sidebar gives a quick summary of the function of the selected object, along the messages and attributes that the selected object understands.
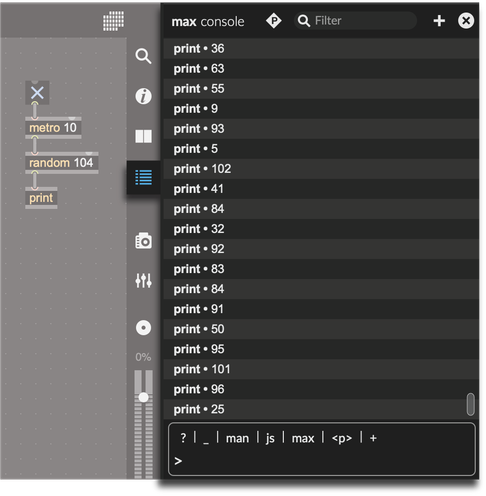
The Max Console displays errors and warnings, in addition to the output of any print objects.
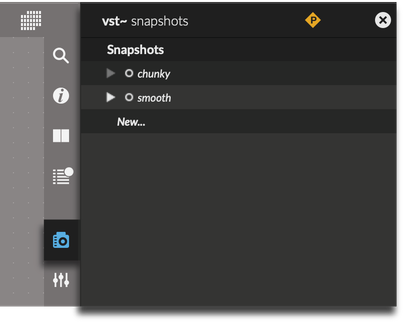
The Snapshot editor lets you view and edit any snapshots belonging to the current patcher.
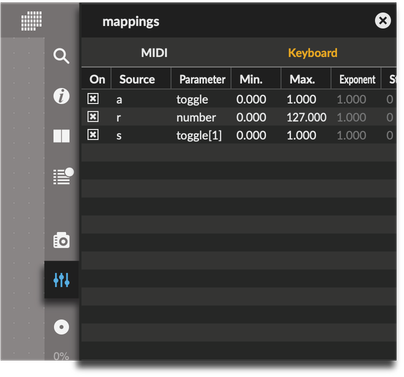
The Mapping button will be enabled if any objects in the current patcher support parameter mapping. From the mapping editor, you can view and configure MIDI and Keyboard mappings.
You can use the Global Record button to quickly record the audio output of your patcher.
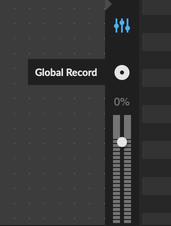
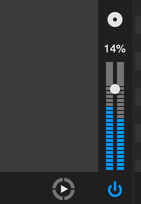
Above the volume control, the Audio CPU Meter tells you how much of your computer's processing power you've used up with signal computation.

If you have a jit.world object in your patch, you can click on the Audio CPU Meter to toggle the FPS Meter for your graphics context. This shows you the rate of graphics processing in frames per second.
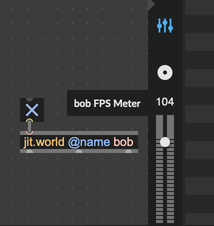
Finally, at the bottom of the right sidebar, the volume control lets you adjust the gain for any audio generated from this patcher. Each patcher has its own gain control.
Bottom toolbar
The bottom toolbar contains controls for changing how you interact with your patcher, including enabling/disabling an alignment grid, turning on signal processing, and more. You can right click on the bottom toolbar and select "Add Mute Audio" or "Add Solo Audio" to enable these optional icons.

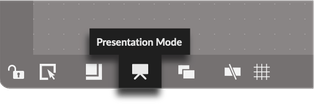
From left to right, the first icon in the bottom toolbar controls Locking, letting you lock/unlock your patcher.

If you're looking at an instance of an Abstraction, then the lock icon will change to a crayon. Clicking this icon will let you modify the orignal patcher.

The Operate While Unlocked icon enables an interaction mode that lets you control UI objects in your patcher, even while the patcher is unlocked.

The Patching Margin icon gives you a bit more room to work with, at the border of a patcher that fills up the entire view.
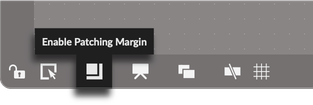
Clicking the Presentation Mode icon will enable/disable presentation mode.
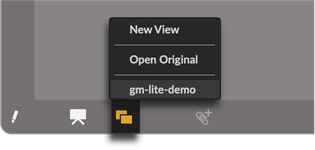
The Patcher Windows button lets you access different views of the current patcher. Click "New View" to open a new window displaying the same contents as the current patcher. This can be useful if you want to look at two different parts of a large patcher at once, or if you want to view a patcher in presentation and patching mode at the same time. If you're looking at an instance of an Abstraction, the option "Open Original" will be enabled, and selecting this option will open the original version of the abstraction. Finally, if you're looking at a subpatcher, the bottom of the menu will let you navigate up the patcher hierarchy to a parent patcher.
Clicking the Show Objects Over Connections button toggles between displaying objects over patch cords, or patch cords over objects.

The Show Grid button will let you enable and disable an alignment grid for your patcher. You can control this same option by selecting Grid from the View menu, and this option works in conjunction with Snap to Grid from the Arrange menu.

With some objects selected in your patcher, the Snippet button will let you save a new snippet from your selection.

The Enable Debugging button will toggle Debug Mode.

You can configure MIDI Mapping by clicking the MIDI Mapping icon.

And you can configure Keyboard Mapping by clicking the Keyboard Mapping icon.

When you hover over an object in your patcher, the Clue Bar will appear in the bottom toolbar. You can configure the appearance and behavior of the Clue Bar using the Clues preference in the Preference Window. If you click on the name of an object in the Clue Bar, Max will show you additional information about that object.
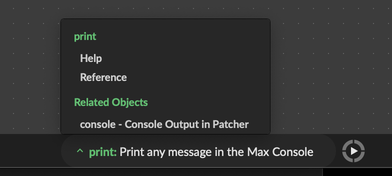
You can set the @annotation attribute on an object to customize the text that appears in the Clue Bar.
You can enable and disable the Global Transport with the Transport icon near the end of the bottom toolbar.

If you enable the optional Mute and Solo icons, these will appear to the right side of the bottom toolbar. These will let you silence audio in the current patcher, or silence all other non-soloed patchers, respectively.
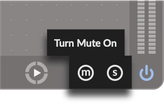
Finally, the Audio On/Off button in the right corner or the bottom toolbar will let you enable or disable audio processing.
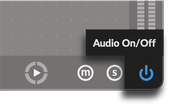
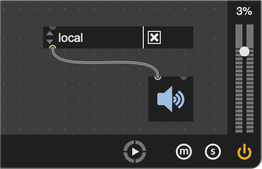
If you enable local audio processing by way of a dac~ object with @local 1, or with the startwindow message, the Audio On/Off button will glow orange instead of blue.
Max for Live Window
The Max patcher window will look slightly different when displaying a Max for Live device.
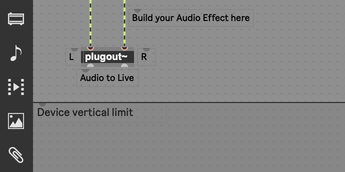
While in edit mode, the patcher will show a line indicating the vertical limit of the device. When editing the device directly from Live by pressing the Edit buton, you cannot adjust the height of this line. However, if you open the .amxd file in Max, you may adjust the position of this line. Changing the position of this line will not affect the height of the device in Live.
Toolbar changes
In the bottom toolbar, the Freeze Device button lets you Freeze and unfreeze your Max for Live device.
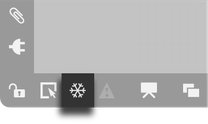
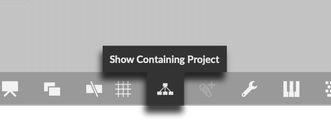
The Show Containing Project button will reveal the Project that contains the Max for Live device. The project is the place to configure properties of your Live device like whether it is an Audio Effect, MIDI Effect, or a MIDI Instrument, among others.
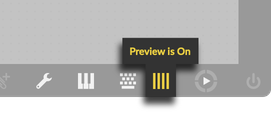
Finally, the Preview button will let you enable/disable preview for the Max for Live device (this button is only available when opening a device from Live by pushing the Edit button). With Preview enabled, audio and MIDI will pass to and from Live, directly into your Max for Live device as you edit it. With Preview disabled, audio and MIDI will bypass your device until you finish editing it.
Gen Window
The window for a Gen patcher has its own toolbar buttons as well. These let you access the special objects supported in Gen, and give you control over when Gen compiles its code.
Toolbar changes (Gen)
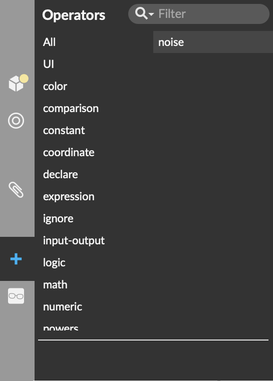
In the left toolbar, the Gen Operators button gives you access to all of the operators supported in Gen, sorted by category. This will display a different set of objects depending on whether the patcher is a Gen DSP (gen and gen~ objects) or Gen Jitter (jit.gen, jit.pix, and jit.gl.pix) patcher.
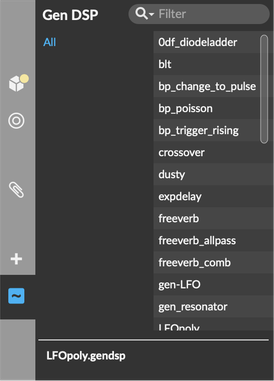
The next button in the left toolbar will be titled either Gen DSP or Gen Jitter, again depending on whether the patcher is a Gen DSP (gen and gen~ objects) or Gen Jitter (jit.gen, jit.pix, and jit.gl.pix) patcher. This button lets you see built-in .gendsp and .genjit patchers, which are essentially Abstractions that are restricted to the Gen domain. Many of these Gen Abstractions are helpful starting points or useful building blocks.
In the bottom toolbar, the Enable Auto-Compile and Compile buttons let you decide when your patcher compiles. With Auto-Compile enabled, your patcher will compile whenever you make a change. If Auto-Compile is disabled, then you can press the Compile button to direct Gen to compile your patcher whenever you're ready. Auto-Compile is enabled by default—disable it if you find that your patcher is taking a long time to compile.

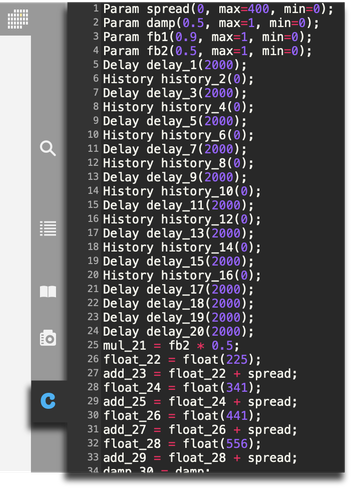
Finally, the Code button in the right toolbar lets you open the Code sidebar. This lets you examine the Gen code that is generated from your patcher. If you want, you can copy-paste this into a Gen codebox.
RNBO window
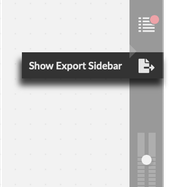
The RNBO window is very similar to the Gen window, which shouldn't be surprising given that both generate code. The most important difference is the Export button in the right toolbar, which gives you access to the Export Sidebar.
Toolbar changes (RNBO)
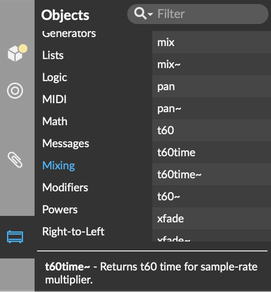
In the left toolbar, the RNBO Objects button will open a browser view for objects belonging to RNBO. You can sort these by category and filter them by name.
Similar to Gen, RNBO patcher windows have Enable Auto-Compile and Compile buttons to let you decide when your patcher compiles. With Auto-Compile enabled, your patcher will compile whenever you make a change. If Auto-Compile is disabled, then you can press the Compile button to direct RNBO to compile your patcher whenever you're ready. Auto-Compile is enabled by default—disable it if you find that your patcher is taking a long time to compile.

If RNBO encounters an error while trying to compile your patcher, an error indicator will appear in the bottom toolbar. Click on the indicator to display the generated source code, which will show on which line the error occurred.

Finally, the Show Export Sidebar button in the right toolbar lets you show and hide the Export Sidebar, from which you can export your RNBO patcher to any of its supported targets.
